A few months ago we announced the availability Circonus One Step Install (COSI) to introduce a very fast way to get data collected for systems with the most obvious set of metrics enabled. This makes monitoring new systems as easy as copying and pasting a command into a shell on the machine to be monitored, or by adding that command into some automation script via Puppet, or Chef, or Ansible, or whatever you use.
Today we are announcing the general availability of “plugins” for COSI, starting with one-step monitoring for Postgres databases.
COSI:postgres builds on the existing COSI workflow outlined in the COSI Tutorial.
After completing a basic COSI install, you can now run the postgres plugin to monitor the box for important postgres telemetry. Below are the steps from the initial login on an EC2 instance to setting up full monitoring of the box and postgres via the COSI:postgres plugin. I have included the installation of the postgres database for completeness, though you may have an existing postgres database which you intend to monitor.
Installation Steps for COSI:Postgres
- Install Postgres. 0:00
	$ ssh machine
	$ sudo bash
	# apt-get install postgresql
- Create a database. 0:20
	# su - postgres
	$ psql
	postgres=# create database foo;
	CREATE DATABASE
	postgres# /q
- Create a table. 0:40
	$ psql foo
	foo=# create table bar (baz text);
	CREATE TABLE
- Add some data. 0:54
	foo=# insert into bar (baz) values (‘some text’);
	INSERT 0 1
	foo=# insert into bar (baz) values (‘some more text’);
	INSERT 0 1
	foo=# insert into bar (baz) values (‘even more text’);
	INSERT 0 1
	foo=# /q
- Monitor this machine with COSI. 1:07
# curl -sSL https://onestep.circonus.com/install | bash \ -s -- \ --key
\ --app \ - Install protocol_observer. 1:32
	# apt-get install golang
	# mkdir go
	# export GOPATH=~/go
	# go get github.com/circonus-labs/wirelatency
	# cd go/src/github.com/circonus-labs/wirelatency/protocol_observer
	# go build
- Ensure that protocol_observer is in the PATH. 2:10
# cp protocol_observer /usr/bin
NOTE: If you place protocol_observer in /opt/circonus/bin, the postgres plugin will find it automatically because that is the default search path.
- protocol_observer requires root privilege to execute, so give ‘nobody’ sudo. 2:24
	# cd /etc/sudoers.d
	# echo “nobody ALL=(ALL) NOPASSWD: /usr/bin/protocol_observer” \
> 91-protocol_observer
- Create an account for the COSI plugin. 2:46
# su - postgres $ psql foo foo=# create user cosi with password ‘
’ CREATE ROLE foo=# grant all on database foo to cosi; GRANT foo=# /q - Modify pg_hba.conf to allow local logins. 3:19
	# nano /etc/postgresql/9.5/main/pg_hba.conf
	…
	# /etc/init.d/postgresql restart
- Finally, run the COSI:Postgres plugin install. 3:44
# /opt/circonus/cosi/bin/cosi-plugin-postgres --enable \
--database foo --user cosi --pass
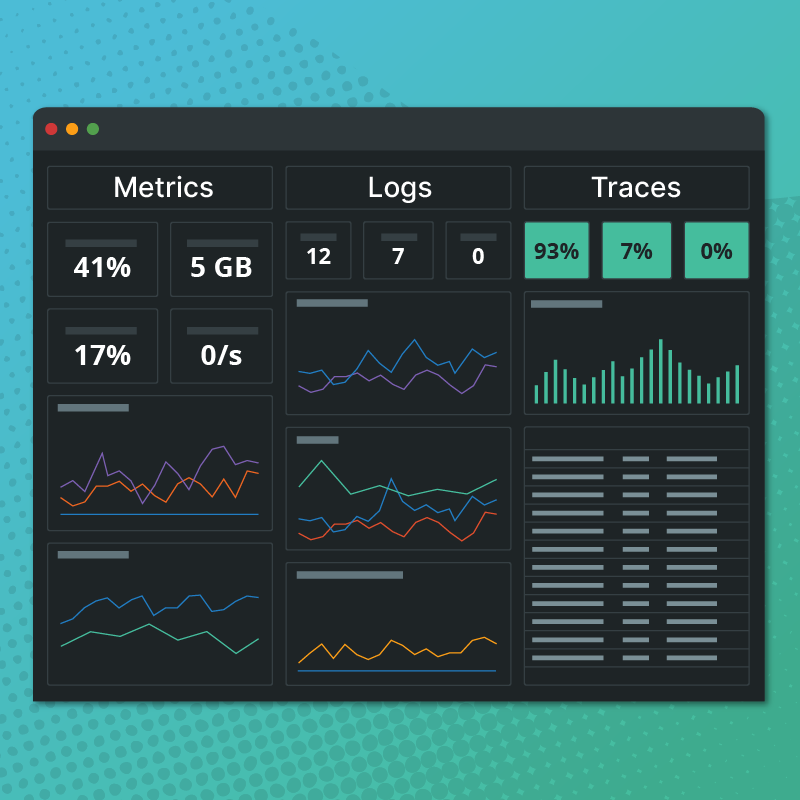
Now you are finished installing the plugin, and you are ready to enjoy your new dashboard and the new functionality if offers.
New Functionality
The postgres plugin for COSI comes with some advanced functionality:
- Optional support for tracking latency of every single query that hits the database
- Cache vs. file system interaction
- A live view of current transactions in flight as well as a historic graph of transaction counts
- Displays what postgres background writers are busy doing
- Forecasts your overall database size in the future!
Let’s break these new features down:
Optional support for tracking latency of every single query that hits the database
In order to support tracking of latency, COSI:postgres requires the circonus-labs/wirelatency tool installed on the box. The `protocol_observer` executable must be in the system PATH and the user that executes the node-agent *must* have sudo permission for the `protocol_observer` executable (covered at 1:32 in the video above). This is because tracking the latency of queries relies on pcapping the network traffic for the postgres port and reconstructing the postgres protocol in order to track when queries come in and when they are responded to. There are a wealth of options for the `protocol_observer` and you can read more about it on the github page.
What you are seeing in these dashboard graphs for query latency is a heatmap containing the latency of every query that hit this postgres server, along with overlays of the overall count of queries (per second) and quartile banding of the latencies. This helps get a good overview of how much time the queries against your postgres instances are taking. If you want to get more advanced, you can apply CAQL queries to this data to extract really useful info.
Cache vs. file system interaction
Problems under postgres are often related to inadequate cache size or too many cache misses which have to hit the actual disk for data. Generally, we want to keep the cache hit percentage as close to 100% as possible. The dashboard widget, “cache hit percentage,” and the graph, “…cache vs. file system,” will help illuminate any cache miss issues and poor performance your database may be experiencing.
A live view of current transactions in flight as well as a historic graph of transaction counts
The dashboard widget, “txns,” and the graph, “… txns,” show a live view and a historic view (respectively) of transactions running against your database instance. Spikes in these indicate hotspots of activity. Here, “txns” means all database interactions (both reads and writes).
Displays what postgres background writers are busy doing
Postgres has several background writer processes which manage commits to disk for postgres. A lag in checkpointing can make database recoveries after crashes a much longer process. This graph will expose problems in the background writer processes. For more on checkpoint statistics, refer to this helpful blog post: “Measuring PostgreSQL Checkpoint Statistics“.
Forecasts your overall database size in the future!
The bottom graph on the dashboard exposes database size as reported by Postgres along with future size. This is calculated using advanced CAQL based resource forecasting.
And more…
In addition to the above features, this new COSI:postgres plugin exposes active and max connection count, transaction details (how many SELECT, INSERT, UPDATE, and DELETE), database scans (how many index reads, sequence scans, and tuple reads is the database doing), and database lock information.
If you are running Postgres instances in our infrastructure and want quick and useful insights into the performance of those systems, using the new COSI:postgres plugin is an easy way to automate collection of these most useful metrics for a Postgres installation in the Circonus system.