Since its release 5 years ago, Kubernetes adoption has exploded. It’s easy to understand why. Kubernetes helps organizations significantly ease and speed application development. But Kubernetes can be challenging to work with. Managing a cluster production is difficult, the ecosystem is constantly changing, and best practices are continually evolving. As a result, Kubernetes monitoring is also complicated. Understanding metrics on cluster health, identifying issues, and understanding how to remediate problems are common obstacles organizations face, making it difficult to fully realize the benefits and value of their Kubernetes deployment. It was with these challenges in mind that we at Circonus built and recently released our Kubernetes monitoring solution.
In this post, we discuss some of the challenges to getting started with Kubernetes and provide an overview of our solution, including how it’s different from any tools that exist today.
The Complexities of Kubernetes
Kubernetes Growth Outpaces Training
Kubernetes was released in July 2015, and since then we’ve seen an explosion of use across organizations of all sizes. In its most recent survey, the Cloud Native Computing Foundation (CNCF) found that in 2019, 84% of respondents were running containers in production, up 15% from the previous year. Just 23% were running containers in March 2016, the first year of the survey. What’s more, 56 percent of the organizations polled for the 2020 edition of The State of Enterprise Open Source report said they expected their use of containers to increase in the next 12 months.
In the technology world, growth like this in just five years — particularly with complex technology that is inherently different from anything else — presents challenges in areas such as professional development and product training. The rapid growth and adoption of Kubernetes is outpacing the rate at which people are able to be trained and gain experience with the technology, leading to a substantial skills gap. IT professionals are being tasked with deploying, managing, and monitoring Kubernetes deployments, but becoming knowledgeable on this technology, which has layers upon layers of abstractions, takes considerable time. In fact, companies are having a hard time finding Kubernetes talent and filling positions.
Just getting a cluster up and running requires a significant number of steps. But many don’t yet have the domain knowledge to actually get these clusters into production. While documentation exists, it’s not straightforward to follow. Kubernetes has an entirely unique lexicon unto itself, and there’s no common background knowledge you can leverage. No matter your background or how long you’ve operated in the cloud, Kubernetes is a different beast. Essentially, you’re starting from scratch.
The Kubernetes Ecosystem Constantly Changes and Lacks Uniformity
The Kubernetes ecosystem is also volatile. There’s a new release once every six weeks or so — releases which often include significant (and sometimes breaking) changes. This can create a ripple-effect throughout the Kubernetes ecosystem, with other tools and technologies now needing to adjust as well.
There’s also not a uniform way of deploying and managing Kubernetes. For example, the three major cloud providers — AWS, Azure, and Google — all approach Kubernetes services very differently. Your experience running Kubernetes in AWS versus Google will vary widely, and depending on your objectives and Kubernetes training level, one cloud provider will be better than another.
Kubernetes Monitoring Challenges
Kubernetes’ strength is also one of it’s weaknesses. It abstracts away a lot of complexity to speed deployment but in doing so, it leaves you blind as to what is actually happening, what resources are being utilized, and even the cost implications of the actions being taken. In addition, Kubernetes has many more components, e.g. servers and services, than traditional infrastructure, making it much more difficult to do root cause analysis when something goes wrong.
Once an organization finally does deploy their Kubernetes clusters, there’s the challenge of monitoring their health and performance. Kubernetes is so inherently different that organizations cannot simply apply existing IT infrastructure monitoring practices and concepts. While tools exist, they are not easy to use or comprehensive enough.
There are several open source Kubernetes monitoring solutions, but they’re very hard to install and work with. Deploying Kubernetes is already a complex, multi-step process, and open source monitoring solutions add to this burden, requiring you to create and install several individual components before you can meaningfully monitor your cluster. And even if you are able to do this well and efficiently to start, monitoring is an iterative process, so you will need to constantly make adjustments.
Several traditional IT monitoring tool providers have introduced Kubernetes monitoring solutions. These solutions, however, are not purpose-built for Kubernetes, lack comprehensive health checks, and are not turnkey. While they provide dashboards, organizations are required to create the alerts and tune them as needed. As a result, dashboards may signal there is some type of problem, but it’s difficult to then identify what the problem is, what’s causing it, and how to fix it.
How Circonus is different
Circonus was built with the challenges of Kubernetes and the limitations of current monitoring solutions in mind. The complex nature of Kubernetes, the skill gap that exists, and the lack of monitoring solutions that are both easy and comprehensive have made it difficult and time-consuming for organizations to understand the health of their Kubernetes clusters and how to address underlying performance problems. As a result, many organizations have been unable to realize the full value of their Kubernetes deployments.
Because of these challenges and limitations, we purpose-built the Circonus Kubernetes monitoring solution. Unlike other offerings, metrics and analysis are specific to Kubernetes, and we provide turnkey, pre-configured health dashboards and alerts. Alerts are integrated with dashboards, allowing organizations to easily visualize and understand what issues exist, and step-by-step remediation instructs operators on how to fix common problems.
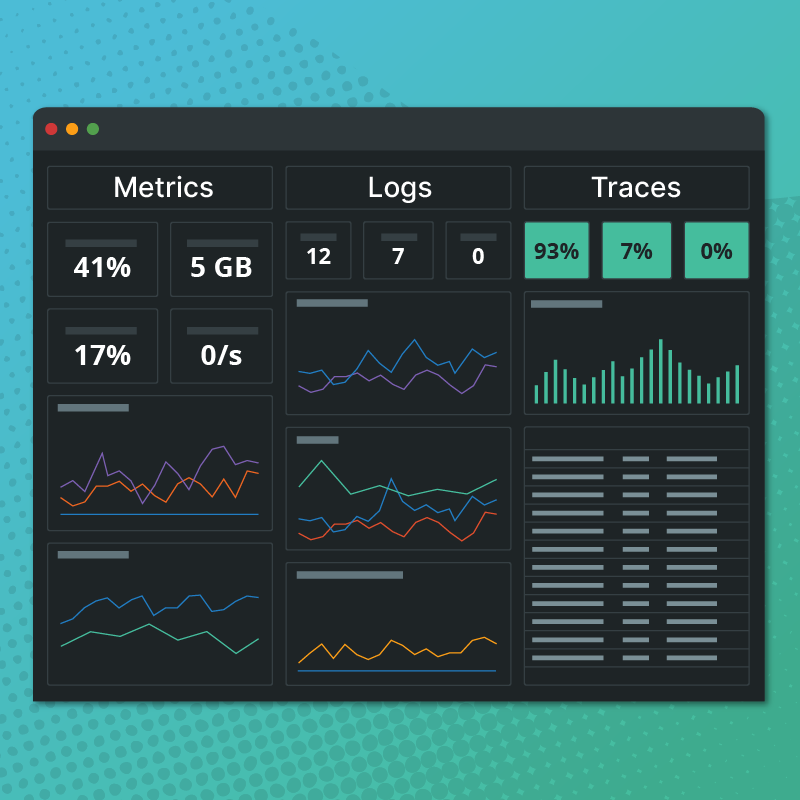
Dashboards and Alerts
Our solution’s real-time operational and health dashboards visualize node and pod resource utilization for easy-to-consume insights. You can explore performance metrics and events for your cluster as a whole, or drill down to explore the performance of a given namespace, application, node, or pod. Our health overview dashboard provides a high level view of your cluster’s health and enumerates 12 different common health conditions that afflict clusters, such as crash loops, disk and memory pressure, job and volume failures, errors, pod pending delays, and deployment glitches. Health conditions highlighted in green are healthy, while those in red are unhealthy and require remediation — making it easy to identify what needs attention.
In addition to these cluster health visualizations, we provide automated alert rules. Our automatic alert rules are based on health and performance criteria specific to Kubernetes and are based on best practices. If any of these rules are violated, an alert is generated. Organizations can reconfigure these if they choose to, but for those who may not have the time or the experience, these automated rules prevent organizations from creating everything from scratch and gives them peace of mind that they will be aware of any significant issues and how to address them.
What’s also unique to Circonus is that we link the health dashboards to the alerts and provide guided issue remediation. For example, if you receive an alert on crash loops, you can click on that alert to visualize the issue in the health dashboard. You will then be provided information on what pod is crashing, root cause details, and potential next steps to remediate it. This integration and immediate in-context guidance saves organizations significant time. No other solution addresses health-based issues like this. Circonus links all information together in a few clicks, and interprets the metrics for you, rather than simply display them.
Installation
While some Kubernetes monitoring solutions require extensive configuration, the Circonus offering can be up and running in just 2-3 commands. Our easy-to-install agent is ready to go in 10 minutes or less and data immediately begins to populate graphs. And because our turnkey alerting and dashboards are available out-of-the-box with zero set-up or configuration required, you can immediately automate your health monitoring. Watch this 90-second video to see just how easy the installation process is.
Working with Kubernetes can be challenging, which is why we made our monitoring solution comprehensive in its capabilities, but automated and turnkey, so organizations are empowered to more easily surface clear, actionable insights that can immediately help them unlock more value from their Kubernetes deployment. But don’t just take our word for it — sign up for the free edition of our Kubernetes monitoring solution and see for yourself. Your clusters will thank you.