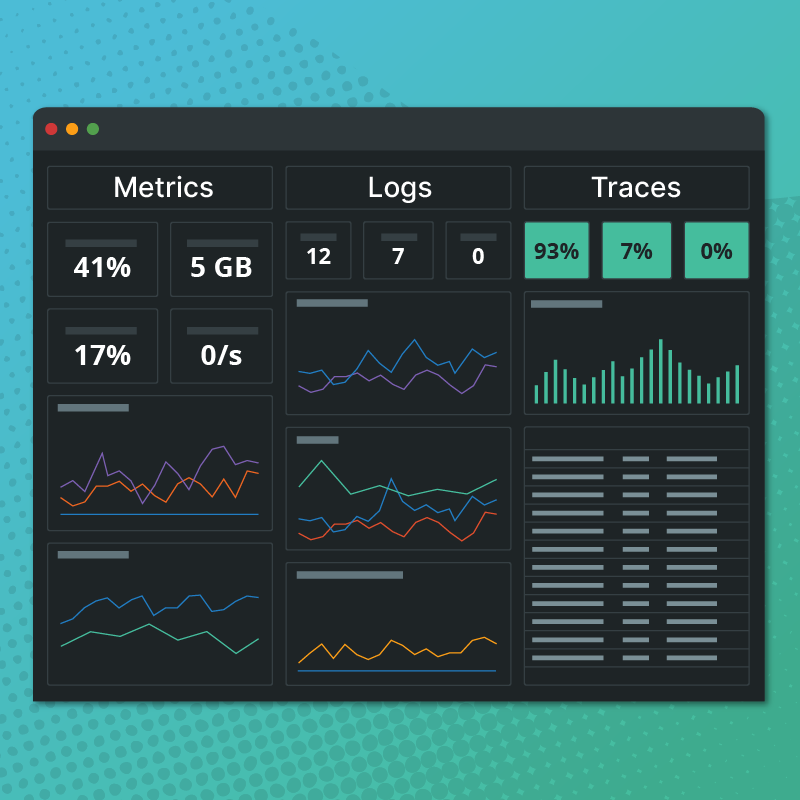
We recently announced the development of our new dashboard builder and associated release of several new turnkey service dashboards. The new dashboard builder provides a vastly improved user experience, enabling users to create dashboards in a fraction of the time it took them previously. As of this month, the dashboard builder, which was previously only accessible internally, is now available to all Circonus customers.
How to Start Using the New Dashboard Builder
To start creating a dashboard with the new builder, first navigate to the main dashboards page. Then, click the “Create” button in the upper right (clicking on the “Create” button arrow offers the option to create a legacy dashboard).

You’re now within the new builder. Here, you may first want to rename your dashboard and create your desired dashboard tabs.

Next, you can begin populating a given tab by clicking the “Add Section” button in the upper right.

Once a section has been added, click on each “widgetable area” or cell to select and configure a type of visualization.

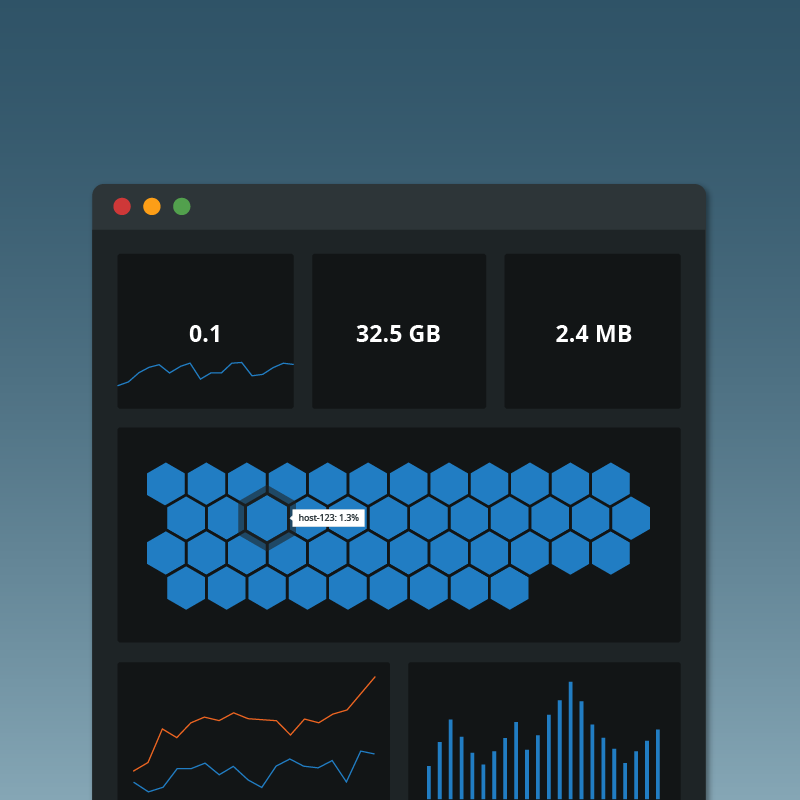
Currently, visualization types include metric trends, single metric, tilemap, and list. As you work on your new dashboard, you’ll notice that the dashboard builder will incrementally save your work.
Read our previous post for more details on using the new builder.
Upcoming Improvements to the Builder
Visualization types will be joined by comparison, status, histogram, histogram heatmap, and image in the near future. Dashboard sharing will also be possible with public, non-Circonus viewers.
Available Service Dashboards
We also now offer service dashboards for some of our most popular integrations. Currently, these include Linux hosts, Circonus Unified Agent (CUA), MySQL, PostgreSQL, Nginx, Kubernetes, Memcached, Apache, ZFS, Windows, and RabbitMQ. These service dashboards are automatically available to users when they configure their account to collect metrics from the associated integration. If any of these are available to you, they’ll be listed on the main dashboards page. We are planning to release additional service dashboards, such as ones for Kafka, HAProxy, Redis, and MCRouter, in the coming weeks.
Read more about our Linux host monitoring dashboard.

Conclusion
We hope you enjoy exploring the new dashboard builder and service dashboards. If you have any feedback or questions, don’t hesitate to reach out to us. Stay tuned for ongoing improvements to the builder as well as additional service dashboards.


