As organizations shift to service-centric environments, they are generating substantially more data. This in turn has placed strains on monitoring and observability teams, who now must sift through an abundance of data in order to identify and resolve issues — a challenge exacerbated by the number of various monitoring tools they’ve implemented over the years.
In today’s IT environment, the traditional approach of leveraging multiple monitoring tools does not align with the new reality. At Circonus, we routinely hear from engineers and IT Operations that the number of solutions their organizations have accumulated has led to rising costs and time to troubleshoot.
Each tool organizations employ has its own licensing costs, upgrades, deployment cycles, customized configurations, and integrations. Inevitably, these costs increase significantly as organizations scale their IT infrastructures and teams.
Also, when teams must analyze different data sources across different tools, they’re forced to manually correlate incidents, many times via exported spreadsheets — substantially increasing time to troubleshoot.
As a result, more organizations are looking to consolidate monitoring with platforms like Circonus, which allows users to ingest and analyze logs, metrics, and traces at any scale from across your entire environment.
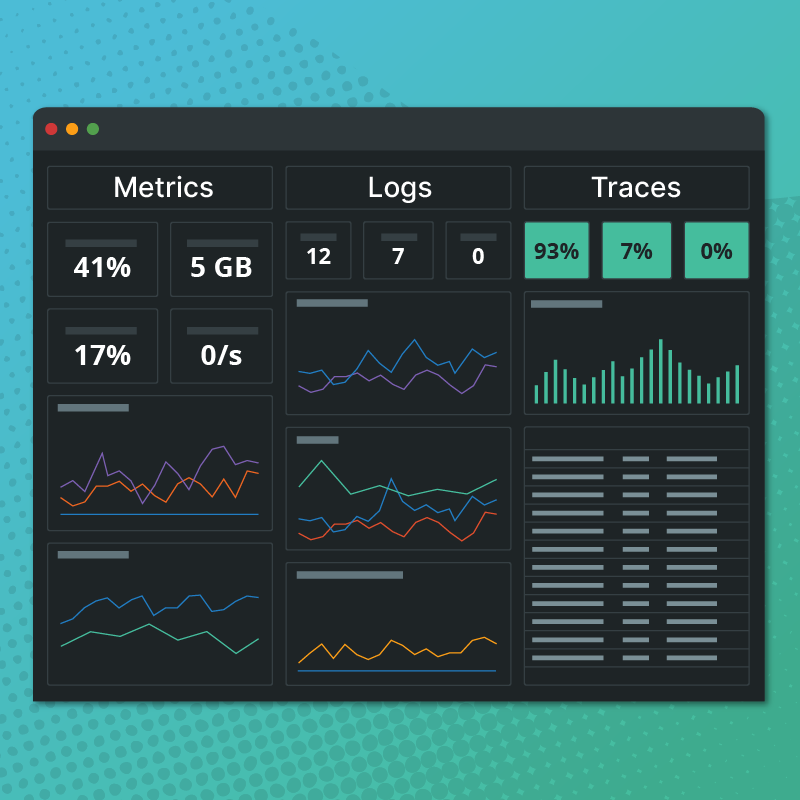
Central to the Circonus platform are our unified dashboards, which provide a single pane of glass to visualize all observability data.
Circonus’ unified dashboards (which are an extension of OpenSearch) give SREs and ITOps teams a single source of truth from which they can quickly correlate all their data and gain full observability across their applications and infrastructure — and as a result more effectively collaborate to resolve issues faster.
In the following, let’s take a look at different charts within our sample unified dashboard, which allows our customers to easily explore metrics, traces, and logs in order to identify trends and changes over time.
Metrics
Resources by node trend graphs
View these graphs to see CPU, Memory, and Disk usage by node. Identify if a node is using more resources than others, or if usage has changed recently.

Network bandwidth by node trend graphs
Use the Network Rx and Network Tx graphs to view if a node is receiving/transmitting more bandwidth than the others, or if its usage has changed recently.

Distributed Traces
“By Service” Trend Graphs
See how many transactions are being received and processed for each service.

See average response time for each service.

See how many transactions receive 4xx or 5xx error responses for each service.

Longest Traces Bar Trend Graph
See the longest-running traces recently to determine if there are any long-running operations that need to be examined. Grab the trace ID from here and dig into the trace data to see where the slowdown is occurring.

Logs
4xx/5xx Errors Trend Graph
See how many transactions receive 4xx responses to identify if too many requests are for unavailable resources or are trying to access resources in an unauthorized manner, and view 5xx responses to see if errors are occurring due to bugs.

4xx/5xx Logs
See log entries for transactions that received 4xx/5xx responses, and dig into the logs to learn more about the requests.

3xx Responses Trend Graph and 3xx Logs
See how many transactions receive 3xx responses to identify requests for resources which have moved or been deprecated.

See log entries for transactions that received 3xx responses, and dig into the logs to learn more about the requests.

More Simplicity, Better Visibility
It’s time to stop going into multiple tools and switching consoles in order to see what’s happening in your stack. Simplify your monitoring by bringing all of your data into one pane of glass. Correlate metrics and traces with logs in a single click to quickly identify root cause and finally gain full visibility across your entire environment. Check out our docs to further explore Circonus dashboards.


