A better way to observevisualizeanalyzetriageimprovemanageoptimizemonitor networks, applications, and infrastructure
![]() “With Passport, Circonus Adds a Real-Time Data Volume Dial to Observability Agents.”
“With Passport, Circonus Adds a Real-Time Data Volume Dial to Observability Agents.”
Nancy Gohring, Research Director, IDC
All your telemetry. All your apps and infrastructure.
One unified platform.
Infrastructure Monitoring
Gain complete visibility into your infrastructure across on-premises, cloud, and hybrid environments. Contextual tagging, advanced analytics, and real-time intelligence help you prevent issues and reduce MTTR.
Network Monitoring
Ensure reliable network operations with full visibility into every network component across your entire environment. Out-of-the-box dashboards and granular network data ensure you quickly detect the cause of performance issues.
Application Monitoring
Understand the path of each request within complex multi-service architectures with end-to-end distributed tracing. Correlate traces with metrics and logs and gain the context you need to reduce latency, identify errors, and improve user experiences.
Ease migration and reduce vendor lock-in with our support for open standards.
Our platform is built from the ground up to utilize standard, open source, and popular tools.
Open source data collection agent support
Circonus supports open source collection agents like OTEL and FluentBit.
Query language support
Out-of-the-box support for open query languages like PromQL, Lucene, and more.
Seamless Grafana dashboard integration
Circonus integrates seamlessly with Grafana dashboards so you can view your data where you want.
Dashboards based on OpenSearch
Visualizations exist as they do in OpenSearch, with extended capabilities.
Elasticsearch compatibility
Your Elasticsearch tools and integrations are compatible with Circonus, ensuring a faster, easier migration.
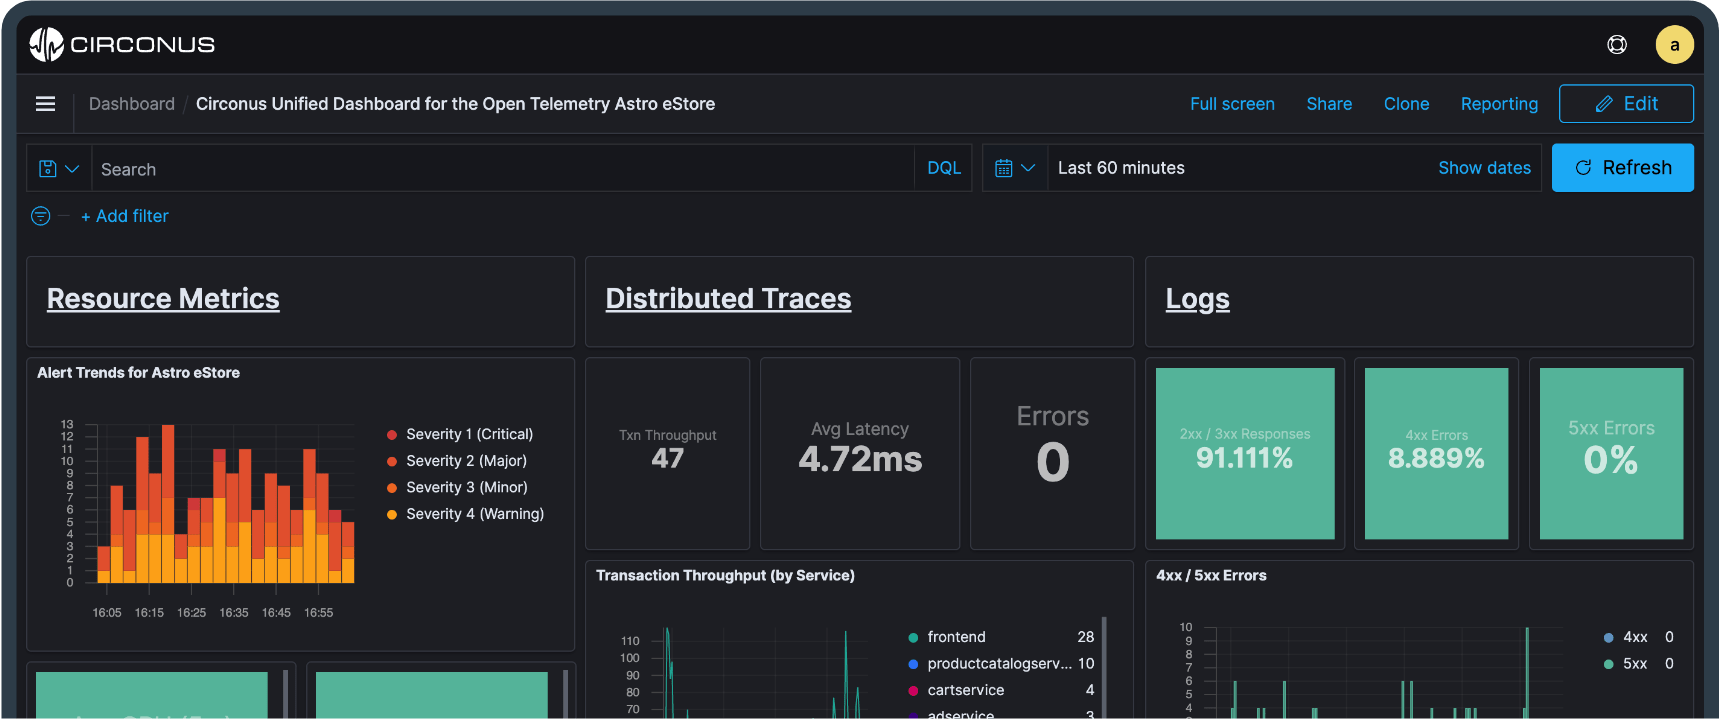
Simple. Powerful. Unified.
View logs, metrics, and traces across your entire environment in a single pane of glass
Why Circonus
A refreshingly simple approach to observability
Monitor any stack with 300+ Integrations.
Circonus supports hundreds of different services and technologies so you can easily plug in your current data sources.