In the dynamic world of IT, the way we monitor systems has seen a remarkable evolution. Gone are the days when monitoring was limited to basic server checks or infrastructure health. With the rise of […]

One of the hardest challenges in computer science is deciding what to name things. Adoption of consistent nomenclature is difficult because there is no one right answer. In fact, it’s not uncommon for different teams […]

We’re excited to announce that we just released the next-generation of our observability platform – the Circonus Telemetry Cloud™. Here’s a closer look at what it is and why we think it’s a standout in […]

Domain Driven Design (DDD) is usually associated with microservice architectures. As microservice architectures have been perceived as burdensome and overly complex, so too have organizations started to call into question the relevance of DDD initiatives. […]
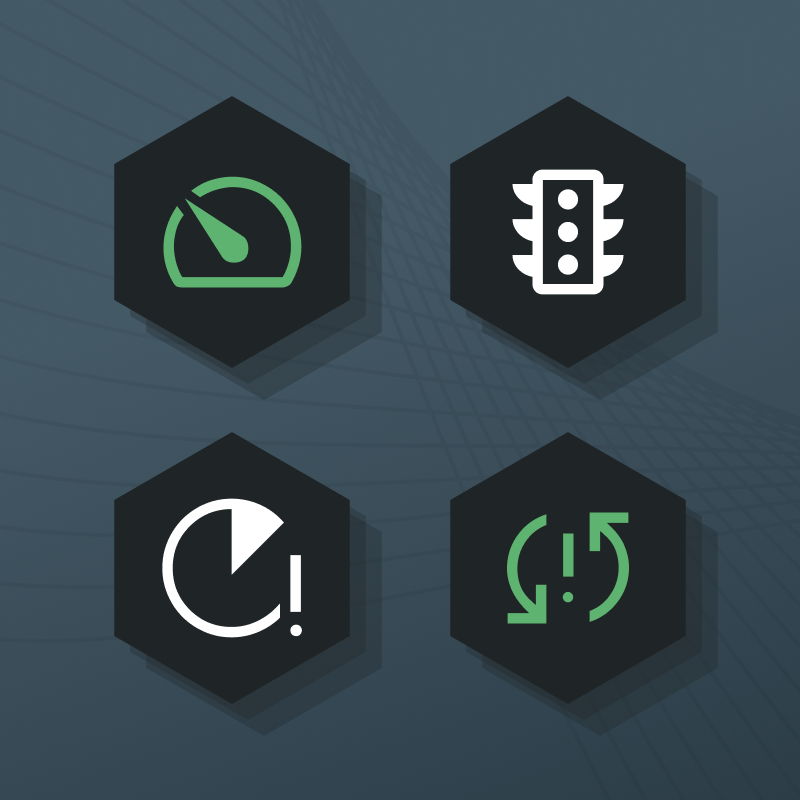
The Four Golden Signals, developed by Google SREs, are key metrics used to monitor the health of your systems. In today’s complex IT environments, these key metrics can help engineers and IT operations prioritize the […]

This past spring, Ron DeSantis used Twitter Spaces to launch his presidential campaign. At least, he tried to. As you may remember, the event was marred with technical difficulties, resulting in false starts, confused hosts, […]
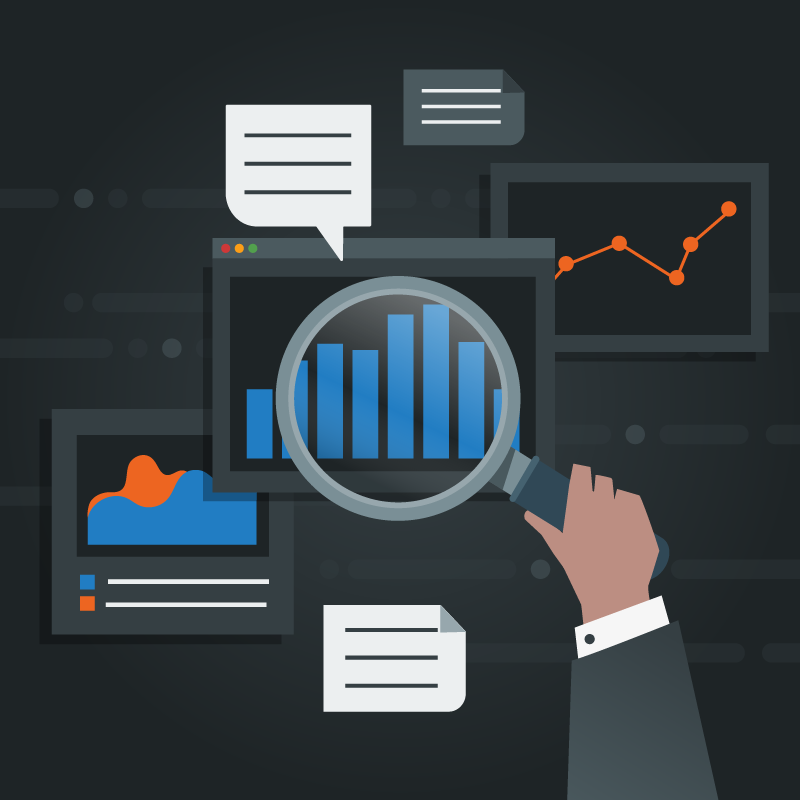
Advanced analytics
Harness powerful analytics to proactively optimize performance, resolve incidents faster, and make smarter decisions with confidence.
Intelligent alerts
Real-time streaming alerts, analytic alerts, and composite alerts ensure you can prioritize issues, reduce false positives, and identify problems before they become outages.
Dashboards & visualizations
Quickly visualize, query, and correlate data from across your stack in real-time dashboards. Analyze metrics, traces, and logs across your entire environment within a single pane of glass.