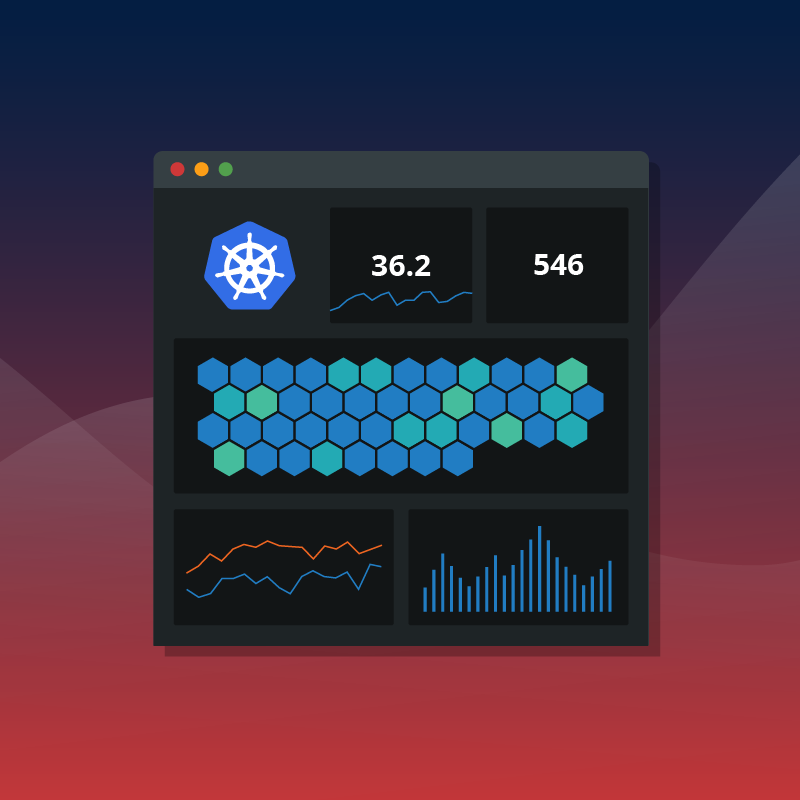
Kubernetes can generate so many types of new metrics (millions every day) that one of the most complex aspects of monitoring your cluster’s health is filtering through these metrics to decide which ones are important […]
Kubernetes monitoring is complicated. Knowing metrics on cluster health, identifying issues, and figuring out how to remediate problems are common obstacles organizations face, making it difficult to fully realize the benefits and value of their […]
Millions of baseball fans tuned into the World Series last week, and we at Circonus were proud to help our customer, Major League Baseball, provide those fans with seamless viewing experiences. To celebrate our partnership, […]
Many organizations relying on Graphite will be leveraging telemetry provided through Statsd. And if you rely on Graphite in combination with StatsD telemetry, you’re likely suffering from aggregation bloat. In a typical Graphite ingestion pipeline, […]
Graphite is a free open-source software (FOSS) tool that monitors and graphs numeric time-series data. Graphite was originally a project developed internally at Orbitz in 2006, which eventually grew to be their foundational monitoring tool. […]

The Graphite database has engineers feeling stuck. Perhaps you’re one of them. You find yourself collecting metrics that were defined years ago when the system was put in place, likely by someone who is no […]
Advanced analytics
Harness powerful analytics to proactively optimize performance, resolve incidents faster, and make smarter decisions with confidence.
Intelligent alerts
Real-time streaming alerts, analytic alerts, and composite alerts ensure you can prioritize issues, reduce false positives, and identify problems before they become outages.
Dashboards & visualizations
Quickly visualize, query, and correlate data from across your stack in real-time dashboards. Analyze metrics, traces, and logs across your entire environment within a single pane of glass.