
GrafanaCon EU 2018 Recap A couple weeks ago at GrafanaCon EU 2018 we announced the beta release of the IRONdb Data Source for Grafana. We’ve continued to make improvements to some features, such as the […]
Today, the Circonus team is releasing the first round of our new User Interface changes. Since we started developing Circonus 7 years ago, we’ve worked with many customers in different spaces with different needs. Our […]
Here at Circonus, we have a long heritage of open source software involvement. So when we saw that Istio provided a well designed interface to syndicate service telemetry via adapters, we knew that a Circonus […]
The USE method was developed by Brendan Gregg to study performance problems in a systematic way.1 It provides a simple, top-down approach to identify bottlenecks quickly and reliably. The gathering of performance metrics is usually done […]

Circonus has always been API-driven, and this has always been one of our product’s core strengths. Via our API, Circonus provides the ability to create anything that you can in the UI and more. With […]
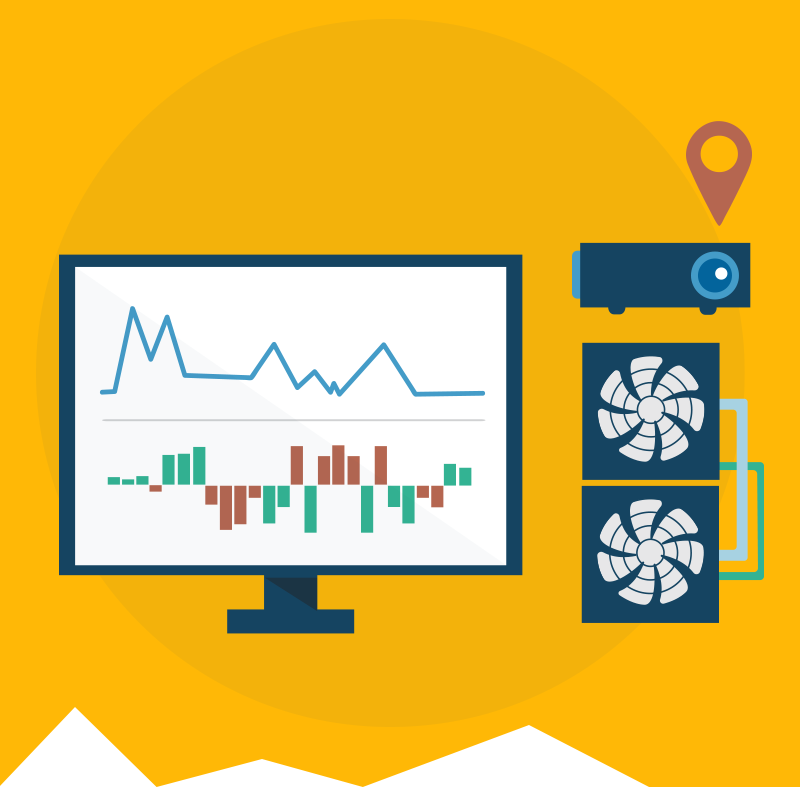
Software is eating the world. Devices that run that software are ubiquitous and multiplying rapidly. Without adequate monitoring on these services, operators are mostly flying blind, either relying on customers to report issues or manually […]

A few months ago we announced the availability Circonus One Step Install (COSI) to introduce a very fast way to get data collected for systems with the most obvious set of metrics enabled. This makes […]

Some of our users tell us that moving to Circonus from in-house operated tools was driven by the desire to outsource responsibility for availability and data safety to someone else. This might sound odd, but […]
Circonus is a full-stack monitoring solution for the modern-day enterprise that delivers crystal-clear, real-time observability of the behavior, health, trends, and performance of the entire enterprise footprint from edge to edge in one unified platform.
40 Lloyd Avenue, Suite 306
Malvern, PA 19355
888-840-8133