Resources • Success Stories
Monitoring the Backtrace Infrastructure with Circonus
Samy Al Bahra is the CTO/Cofounder of Backtrace, the startup which helps engineers detect errors, understand root causes and impacts, and improve time to resolution. Here, he shares with our audience how his team leverages Circonus to monitor their infrastructure.
INDUSTRY
Software
HEADQUARTERS
New York
CUSTOMER SINCE
2010
REGIONS
Americas, Asia Pacific, Europe
USERS
250,000
REVENUE
18 Million
Tracking Latency Distributions in Real-Time
“At Backtrace we rely on Circonus for all of our alerting, as well as our real-time analytics. Prior to adopting Circonus, we didn’t really have much visibility into real-time usage of the product, real-time performance bottlenecks, etc.”
“Because we are a small team, it was important for us to have a holistic platform for both alerting and metrics. The Circonus API is very flexible, which allowed us to easily integrate alerting into even the more customized portions of our stack. As far as alerting is concerned, the Circonus interface ensures that an engineer can do the bulk of the legwork and then easily scale that into something that is reproducible as our ecosystem expands. As the number of machines grew and more new components were integrated into our stack, we found that the Circonus API could integrate with any components we needed.”
At its foundation, Circonus is an API driven platform. As a RESTful service, the Circonus API is designed to allow users to programmatically adjust monitors and alerts as their architecture evolves. The web portal front-end of the Circonus UI is just one interpretation of the Circonus API. Other Circonus customers can, and have, created their own front-ends. The Circonus back-end can be accessed via the API from any system you wish. This API enables many third-party and internal tools. Examples of internal tools would include Python, Ruby, or Java programs you write to programmatically configure alerts (as Backtrace has done) or otherwise modify your Circonus account.
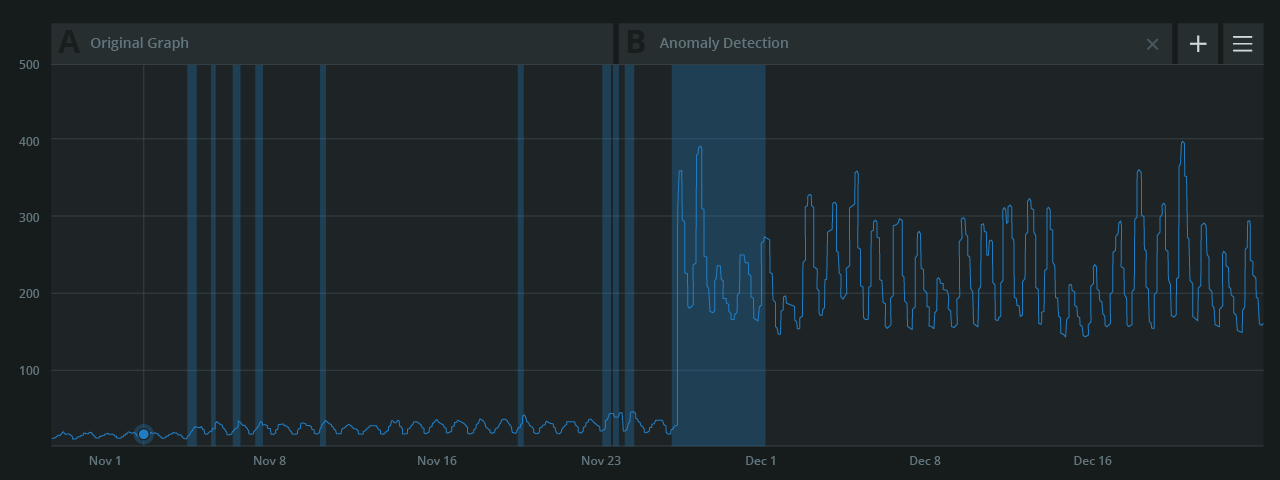
“In particular, one thing that sets Circonus apart from competitors is the first class support for native applications. We have a high performance object store which is central to Backtrace and which exposes a lot of complex analytics. Some of those analytics include distribution data. We wanted real-time tracking into latency distributions, and we couldn’t find another solution that had the same functionality as Circonus.”
Checks and Data Ingestion
Checks are protocol-specific methods of data ingestion. Circonus has over 40 of these ingestion-specific integrations to support native applications and is adding new ones all the time. Even without a pre-made integration, custom checks, such as JSON checks, allow Circonus to push, pull, or reverse pull data from any kind of system. This flexibility in data ingestion is further supported by the API.
“The other great thing is that Circonus also provides an open source library called libcircmetrics which we’ve integrated with our object store. This library allowed us to start streaming real-time analytics in what basically amounted to a half a day of work. I look at the product alternatives out there, and none of them provide this type of integration support for C++, C, Java, Javascript, or Go codebases.”
The libcircmetrics is a C library for tracking metrics. It’s available on Github along with other open source projects from Circonus Labs, including other integration support for C, C++, and Go.
Support for Scalability
“Circonus provides key support that removes technological barriers. We did examine other options and compared Circonus head-to-head with other metrics and analytics solutions, but they did not have the same level of support for C/C++ applications. That means it would have been up to our engineers to build the integrations for those services to ingest our data. As a startup, that’s not something that we had time for. Circonus provides a plug-and-play solution for C and C++ applications which enabled us to stream that data.”
The philosophy behind the API first design of Circonus is to allow engineers to treat any problem as a software problem. Engineers should have the tools to treat their infrastructure as code, so you should be able to treat your monitoring tools as code as well. The goal of a fully automatable API-Centric platform is to be open, customizable, and integrate with existing tools, just like you would want from any other part of your code base.
“I would say the key business differentiator of Circonus, at least for our type of installation at Backtrace, is significantly more cost-effective than competing solutions because of its metrics-driven pricing model. It was initially difficult to grasp that concept because there aren’t any other companies that do this in the metrics space, but it turned out to be significantly more cost-effective. We have 20 to 30 nodes that are using C. Monitoring that volume of data may have been cost-prohibitive under a node-based pricing model, but the metrics-driven pricing model is cost-effective without imposing any limitations on our infrastructure.”
Advanced analytics
Harness powerful analytics to proactively optimize performance, resolve incidents faster, and make smarter decisions with confidence.
Intelligent alerts
Real-time streaming alerts, analytic alerts, and composite alerts ensure you can prioritize issues, reduce false positives, and identify problems before they become outages.
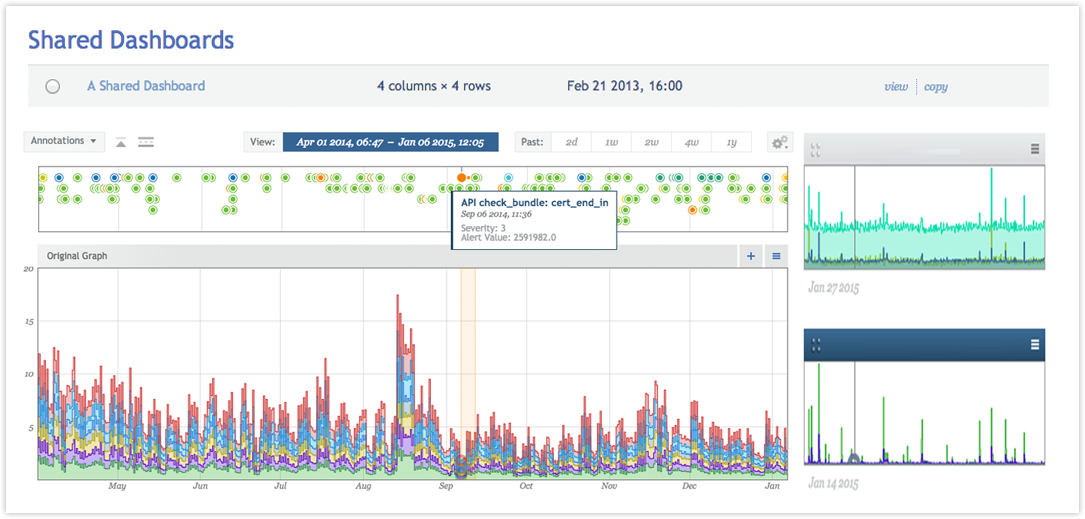
Dashboards & visualizations
Quickly visualize, query, and correlate data from across your stack in real-time dashboards. Analyze metrics, traces, and logs across your entire environment within a single pane of glass.