Resources • Success Stories
Streaming video service harnesses Circonus’ RESTful API for infrastructure automation
At Circonus, it is our mission to help engineers understand the behaviors of their systems. What enables this mission is our API-centric design philosophy, which allows our monitoring platform to be fully automatable, open, customizable, and to integrate with existing tools. Our API enables our customers to treat their infrastructure, including their monitoring solution, as code. Our customers are experienced engineers who chose us because of their need to monitor dynamic infrastructures and apply infinite queries to their data. Our customer, Alem Abreha, a Sr. Service Reliability Engineer for a large cable company, approached us to share his experiences with our platform.

INDUSTRY
Entertainment
HEADQUARTERS
New York
CUSTOMER SINCE
2010
REGIONS
North America
Circonus in Infrastructure Automation: a Puppet Example
By Alem Abreha, Sr. Service Reliability Engineer for a major cable provider
Linkedin: https://www.linkedin.com/in/alemabreha
Twitter: @aabreha
Summary
Creating Circonus API objects (Checks, Graphs, Alerts, etc.) and maintaining their configuration for a continuously changing infrastructure creates a high demand for automation. Manual configurations/setups through the Circonus UI or API can be unintuitive, but the good news is that Circonus has RESTful endpoints for all of the configuration tasks associated with creating, updating, and deleting API objects (note: some of the API endpoints are read-only). Using check management as an example is a great way to demonstrate how we use Circonus as part of infrastructure automation with puppet.
In terms of how metrics are collected, there are two broad classes of check_bundles:
- PUSH – metrics data sent by an active agent on a host/application source (i.e. broker collects metrics in passive mode)
- PULL – metrics data is queried by a Circonus broker from a passive data source (i.e. broker collects metrics in active mode)
Case 1 : PUSH metric check_bundles
This is an obvious case that is ready for automation. Taking the NAD agent host check as an example, configuration management can be handled by including the NAD agent installation and configuration in existing infrastructure automation tools. It can be built into a RPM or DPKG package for installation, but here is a puppet example using Circonus-One-Step-Installation (COSI):
class circonus_agent {

  file {['/usr/local',
  '/usr/local/ccm',
  '/usr/local/ccm/bin',]:
	ensure => directory,
	mode   => 0755,
	owner  => root,
	group  => root,
  }
  file {'/usr/local/ccm/bin/install_nad_agent.sh' :
	ensure  => present,
	owner   => root,
	group   => root,
	mode    => 755,
	source  => 'puppet:///modules/circonus_agent/install_nad_agent.sh',
	require => File['/usr/local/ccm/bin'],
	notify  => Exec['exec_nad_installer'],
  }
  exec {'exec_nad_installer':
	command => '/usr/local/ccm/bin/install_nad_agent.sh',
	logoutput => true,
  }
}
The install_nad_agent.sh script runs the COSI curl command:

#!/bin/bash
# Installs NAD agent using Circonus COSI - https://github.com/circonus-labs/circonus-one-step-install/wiki
#

KEY="fdffdfdffd-d241-c13c-97e3-234567def456a"
APP="circonus:osi:0018fd34728dffff7890dff87326067a35a1be7b2e3545bdaf3458372cbff759"

# Check if installed
if [[ -f /opt/circonus/cosi/bin/cosi ]] ; then
	output=`/opt/circonus/cosi/bin/cosi check list --long --verify`
	if [[ "$output" =~ "OK" ]]; then
		echo "NAD agent is installed and check is OK. Skipping nad install .. "
		echo $output
		exit 0
	fi

fi
# Run cosi
/usr/bin/curl  -sSL https://onestep.circonus.com/install | bash  -s -- --key $KEY --app $APP
)
COSI sets up the check, automatically enables metrics, and creates some basic graphs. For other PUSH check types, particularly HTTPtrap (JSON Push), using telemetry submission libraries (like circonus-go-metrics) imported into applications generating metrics will also enable metrics automatically. It is important to mention here, that COSI can also be used to create PULL type checks.
Case 2 : PULL metric check_bundles
This is the case where all of the check_bundle configuration is done through the Circonus UI or API. The need for automation of these type of checks to be tied into an existing configuration management is most important when the infrastructure is continuously changing (For example, when there are new deployments to augment capacity or short-lived VMs/Containers that got spun-up during peak hours). Such use cases demand streaming of metrics as soon as the host/node is up.
For the remainder of the blog, I will be talking about an approach I took to align the management of PULL check_bundles into Puppet by using Go “text/template” for templating and consuming Circonus APIs.
I started out by creating a directory tree which can serve as a Circonus configuration repository. Using this structure, I was able to separate host specific parameters from common template parameters and also build a logical mapping between hosts and corresponding configurations.
			ccm_test_repo/
			├── ccm_configs
			│ └── check_x1.json
			├── ccm_hosts
			│ └── test_hosts.yml
			├── ccm_templates
			│ └── check_x.json
			└── tenant.yml
Circonus check configuration repo directory tree
Here is what each directory/file is going to hold:
ccm_test_repo : This is the repo name , it can be anything , using ccm_test_repo as an example.
tenant.yml : Circonus account info file. This file contains the Circonus API endpoint and authentication token for verifying and creating check bundles.
Example:
$ cat tenant.yml
# tenant : circonus account config file
circonus_api_token : 4e79ff58-6b94-603f-f64f-9b2761a7ffff
circonus_app_name : tenantx
circonus_api_url : https://api.circonus.com/v2/
$
ccm_configs : This will hold several JSON configuration files that correspond to an application and host grouping. The value of the “host_group” field in config files corresponds to the group_name key in files under ccm_hosts. The value of the “template_file” field corresponds to the template file under the ccm_templates directory where values from configuration file will be mapped.
Example:
$ cat check_x1.json
{
  "host_group" : "web_app",
  "template_file" : "check_x.json",
  "broker" : "9898",
  "display_name" : "web_stats",
  "notes" : "notes",
  "period": 120,
  "target" : "",
  "timeout" : 60,
  "type" : "json",
  "config_header_host":"",
  "config_http_version":"1.1",
  "config_method":"GET",
  "config_payload":"",
  "config_port":"80",
  "config_read_limit":"0",
  "config_url":"url",
  "config_query":""
}
$
ccm_hosts : yml files that have a list of hosts belonging to a group. In the example below, “web_app” is a group name that corresponds to the value of “host_group” in the above configuration file (check_x1.json).
Example :
$ cat test_hosts.yml
group_name : web_app
members :
  - web-lab-alfa.xyz.net
  - web-lab-beta.xyz.net
  - web-lab-gamma.xyz.net
$
ccm_templates : This will hold JSON check template files that have “golang text/template” formatting for variable replacement. Strings with {{.Param}} format are template variables to be replaced by values from configuration files. I created a configuration-to-template key map table to cover the configuration fields needed for the PULL checks for this example.
Example:
$ cat check_x.json
{
  "brokers": ["/broker/{{.Broker}}"],
  "config": {
	"header_host":"{{.Target}}",
	"http_version":"{{.ConfigHTTPVersion}}",
	"method":"{{.ConfigMethod}}",
	"payload":"{{.ConfigPayload}}",
	"port":"{{.ConfigPort}}",
	"read_limit":"{{.ConfigReadLimit}}",
	"url":"http://{{.Target}}/stats.json",
	"query":"{{.ConfigQuery}}"
  },
  "display_name": "{{.DisplayName}} {{.Target}}",
  "notes": "{{.Notes}}",
  "period": {{.Period}},
  "tags": ["tag:tag1","tag:tag2"],
  "target": "{{.Target}}",
  "timeout": {{.Timeout}},
  "type": "{{.Type}}",
  "metrics": [
	  {
		"status": "active",
		"name": "latency",
		"type": "numeric",
		"units": null,
		"tags" : ["metric_tag:metric_tag1","metric_tag:metric_tag2"]
	  },
	  {
		"status": "active",
		"name": "thruput",
		"type": "numeric",
		"units": null,
		"tags": ["metric_tag:metric_tagx","metric_tag:metric_tagy"]
	  }
]
}
$
Now that all the pieces from Figure 1 are in place, what remains is a script to parse the configuration repo tree and consume Circonus APIs to orchestrate the check_bundle configuration. ccm_orchestrator.go does this final part of the configuration management.
Note, this script creates a check_bundle if it doesn’t already exist, but doesn’t manage changes to an existing check_bundle.
Example: ccm_orchestrator.go output
$ go run ccm_orchestrator.go -repo ccm_test

2017/02/07 07:50:51 [ ccm-orchestrator ] environmental variables set
2017/02/07 07:50:51 APP_NAME :  tenantx
2017/02/07 07:50:51 API_TOKEN :  fac1234ff7-345f-afda-ffff-abcf12325f
2017/02/07 07:50:51 API_URL :  https://api.circonus.com/v2/
2017/02/07 07:50:51 -> parsing ccm_configs
 [check_x1.json]
2017/02/07 07:50:51 mapping configuration for:  check_x1.json
2017/02/07 07:50:51 host_group :  web_app
2017/02/07 07:50:51 member hosts :  [web-lab-alfa.xyz.net web-lab-beta.xyz.net web-lab-gama.xyz.net]
2017/02/07 07:50:51 loading template: 	 ccm_test/ccm_templates/check_x.json  for host:	 web-lab-alfa.xyz.net
2017/02/07 07:50:51 loading template: 	 ccm_test/ccm_templates/check_x.json  for host:	 web-lab-beta.xyz.net
2017/02/07 07:50:51 loading template: 	 ccm_test/ccm_templates/check_x.json  for host:	 web-lab-gama.xyz.net

... output is truncated ...
 {"_created":1486471856,"status":"active","_reverse_connection_urls":["mtev_reverse://1.2.3.4:43191/check/12934dfaef12-aefb-4f08-ab89-1234abcd1210"],"target":"web-lab-gama.xyz.net","_checks":["/check/2194839"],"timeout":60,"metrics":[{"status":"active","name":"latency","type":"numeric","units":null,"tags":["metric_tag:metric_tag1","metric_tag:metric_tag2"]},{"status":"active","name":"thruput","type":"numeric","units":null,"tags":["metric_tag:metric_tagx","metric_tag:metric_tagy"]}],"_last_modified":1486471856,"brokers":["/broker/9898"],"_last_modified_by":"/user/1234","period":120,"_cid":"/check_bundle/156127","display_name":"web_stats web-lab-gama.xyz.net","tags":["tag:tag1","tag:tag2"],"_check_uuids":["12934dfaef12-aefb-4f08-ab89-1234abcd1210"],"notes":"notes","type":"json","config":{"read_limit":"0","reverse:secret_key":"19283abc-ffff-4a89-a5bf-98231ac410fa","port":"80","http_version":"1.1","header_host":"web-lab-gama.xyz.net","url":"http://web-lab-gama.xyz.net/stats.json","payload":"","method":"GET"}}

$
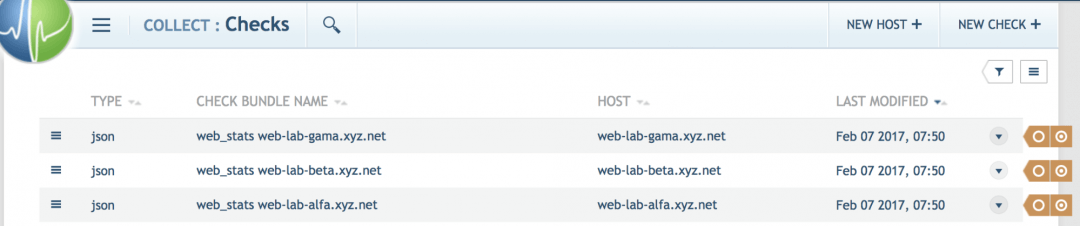
This output shows the check_bundle API objects are successfully created. Here is a screenshot taken from the UI:
Turning this into a puppet manifest looks like this:
class circonus_ccm {

  File {
	ensure  => present,
	owner   => root,
	group   => root,
	mode    => 755,
  }
  # ccm directory tree
  file {['/test/ccm_test',
	   '/test/ccm_test/ccm_configs',
	   '/test/ccm_test/ccm_templates',
	   '/test/ccm_test/ccm_hosts',]:
	ensure => directory,
  }
  # circonus tenant info
  file {'/test/ccm_test/tenant.yml' :
		source  => 'puppet:///modules/circonus_ccm/tenant.yml',
		require => File['/test/ccm_test'],
		notify  => Exec['ccm_orchestrator'],
	  }
  # hosts file
  file {'/test/ccm_test/ccm_hosts/test_hosts.yml' :
	  source  => 'puppet:///modules/circonus_ccm/test_hosts.yml',
	  require => File['/test/ccm_test/ccm_hosts'],
	  notify  => Exec['ccm_orchestrator'],
	}
  # config file
  file {'/test/ccm_test/ccm_configs/check_x1.json' :
	source  => 'puppet:///modules/circonus_ccm/check_x1.json',
	require => File['/test/ccm_test/ccm_configs'],
	notify  => Exec['ccm_orchestrator'],
  }
  # circonus template file
  file {'/test/ccm_test/ccm_templates/check_x.json' :
	  source  => 'puppet:///modules/circonus_ccm/check_x.json',
	  require => File['/test/ccm_test/ccm_configs'],
	  notify  => Exec['ccm_orchestrator'],
	}
# circonus orchestrator script
  exec {'ccm_orchestrator':
	command => '/test/ccm_test/ccm_orchestrator -repo /test/ccm_test/',
	logoutput => true,
  }
}
Therefore, by keeping the configuration repository on a utility host that is running puppet agent and defining a puppet module as shown above, maintaining the check configuration becomes completely hands-off as long as the lists of host groups in ccm_hosts are managed by the infrastructure workflow to add new hosts as they come onto the network.
Conclusion
This demo shows one way of approaching automation around the management of Circonus configuration. Similar approaches can be taken to handle most of the API objects that will need some sort of configuration management. For example, automation of creating graphs, dashboards, alerts, and more. At the heart of it is the abundance of APIs on Circonus which provides unlimited range of possibilities for integration and automation. The bottom line is, there is a lot of room for building Circonus integration into our ubiquitous enterprise tools, which means that adopting Circonus makes life cushy for new users like me.
Advanced analytics
Harness powerful analytics to proactively optimize performance, resolve incidents faster, and make smarter decisions with confidence.
Intelligent alerts
Real-time streaming alerts, analytic alerts, and composite alerts ensure you can prioritize issues, reduce false positives, and identify problems before they become outages.
Dashboards & visualizations
Quickly visualize, query, and correlate data from across your stack in real-time dashboards. Analyze metrics, traces, and logs across your entire environment within a single pane of glass.