Distributed Tracing

Correlate all your data with end-to-end distributed tracing and unified observability at scale.

Circonus’ end-to-end distributed tracing built on OpenTelemetry lets you understand the path of each request within complex multi-service architectures. Easily correlate traces with metrics and logs to quickly identify root cause and gain the context you need to reduce latency, identify errors, and improve user experiences.

Correlate metrics, traces, and logs to troubleshoot faster

  • Visualize and analyze your metrics, traces, and logs across your stack in one unified dashboard.

  • Rapidly triage issues by viewing surrounding log events and correlated traces at the click of a button to quickly identify root cause.

  • Visualize traces through an intuitive UI and powerful analytics.

Improve insights with trace analytics

  • Visualize the end to end path of a request to pinpoint latency.

  • Identify problems within an operation by viewing average latency, error rate, and trends of complete traces or individual spans payloads.

  • Drill down on spans within a trace and view a detailed summary of an individual span.

Boost visibility and pinpoint issues

  • See how various services are connected to each other in the interactive Services map, which auto-discovers all services within an application.

  • Trace call sequences from any service endpoint.

  • Sort by error rate or latency to investigate the root cause of problems within your application.

How SREs Can Achieve More Success by Implementing Modern Monitoring

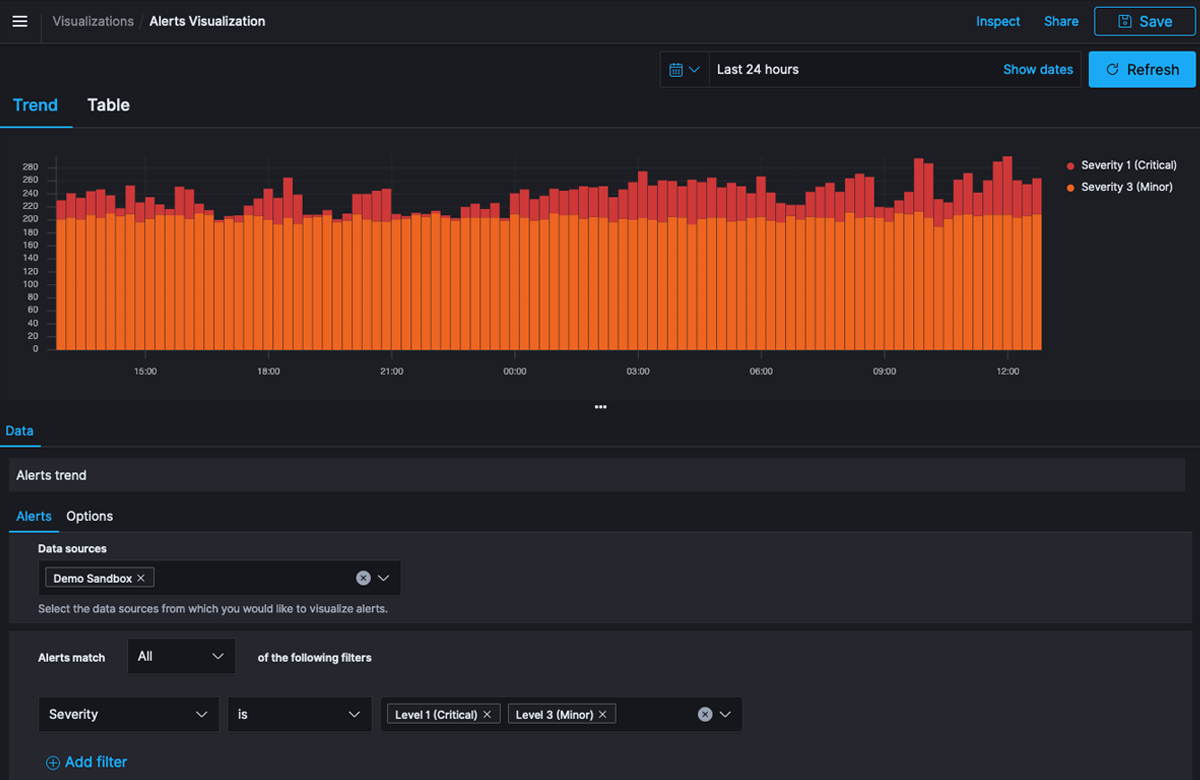
Respond faster with real-time alerting

  • Visualize alert trends to see active alerts across your traces and filter by severity.

  • Alert on latencies in service execution and on endpoints with high invocation rate.

  • Identify potential issues through analytic alerts that identify patterns across traces.
  • Stay notified with integrations such as Pager Duty, Victorops, and Opsgenie, as well as Slack, email, SMS, webhooks, and more.
Alerting Visualization
Circonus Web Traffic Dashboard

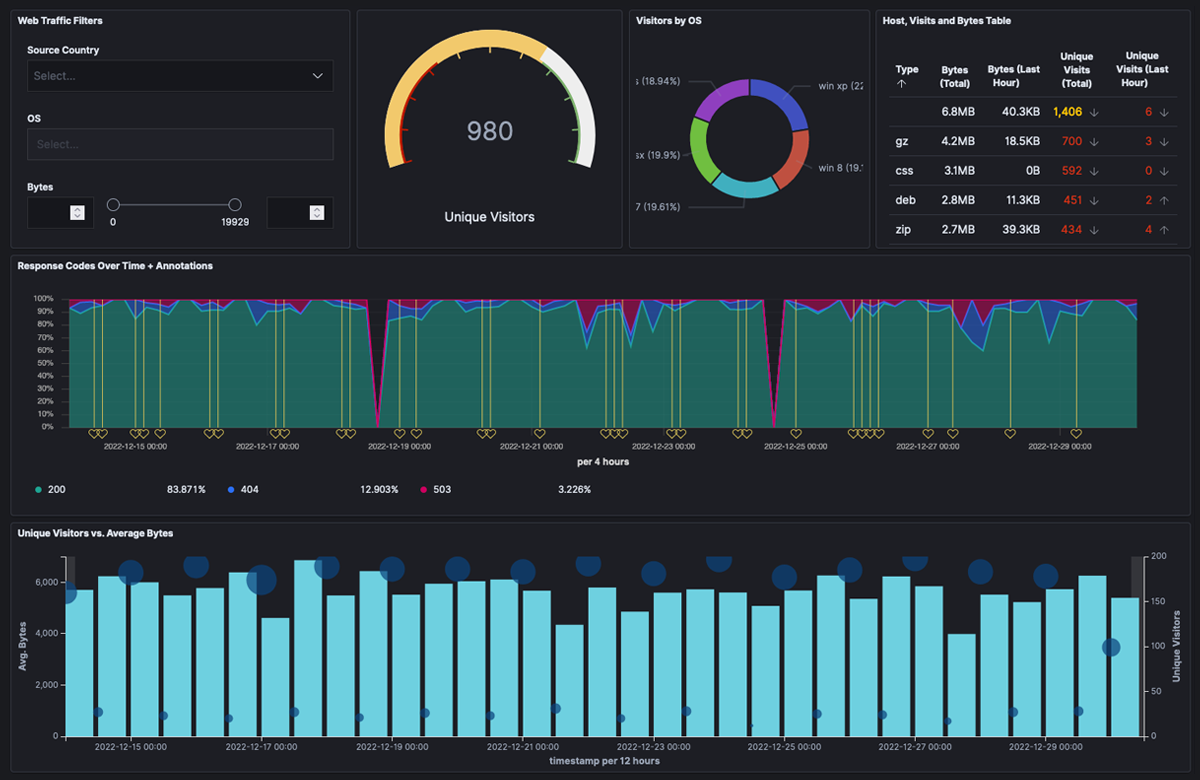
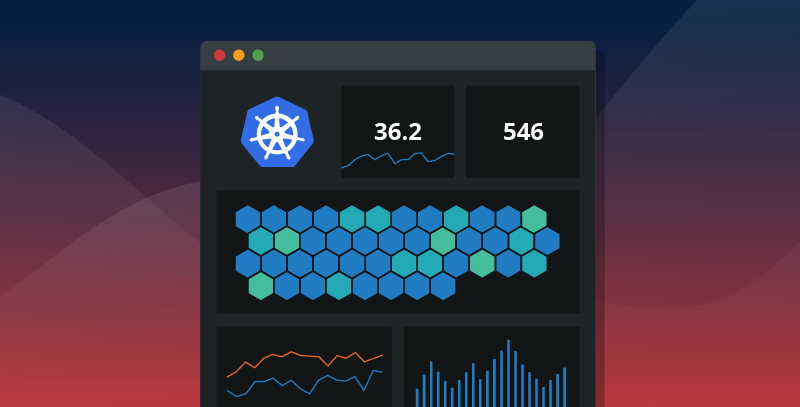
Monitor any stack, at any scale

  • Ingest, analyze, and store traces from any stack with unlimited scale and retention.

  • Highest ingestion frequency ensures you have the most accurate analysis.

  • Access hundreds of integrations for visibility into Java, .NET, PHP, Node.js, Ruby, Python, Go, or C++ applications.

  • Leverage support for vendor-neutral standards such as OpenTelemetry and OpenTracing.

Our customers have zero tolerance for latency, and any second of downtime is money lost in terms of time and productivity. We were able to leverage Circonus to assess and analyze our service delivery, helping Flickr deliver photos about 25% faster today than it did last year.

Don MacAskill, CEO
SmugMug

See where Circonus can take you.

Learn how monitoring without limits can drive new levels of value and impact in your business and operations.