Circonus supports Prometheus APIs, data ingest, PromQL, and Grafana dashboards, so everything you’ve already built around your applications, processes, and all Grafana dashboards and alerts work with Circonus out-of-the-box.
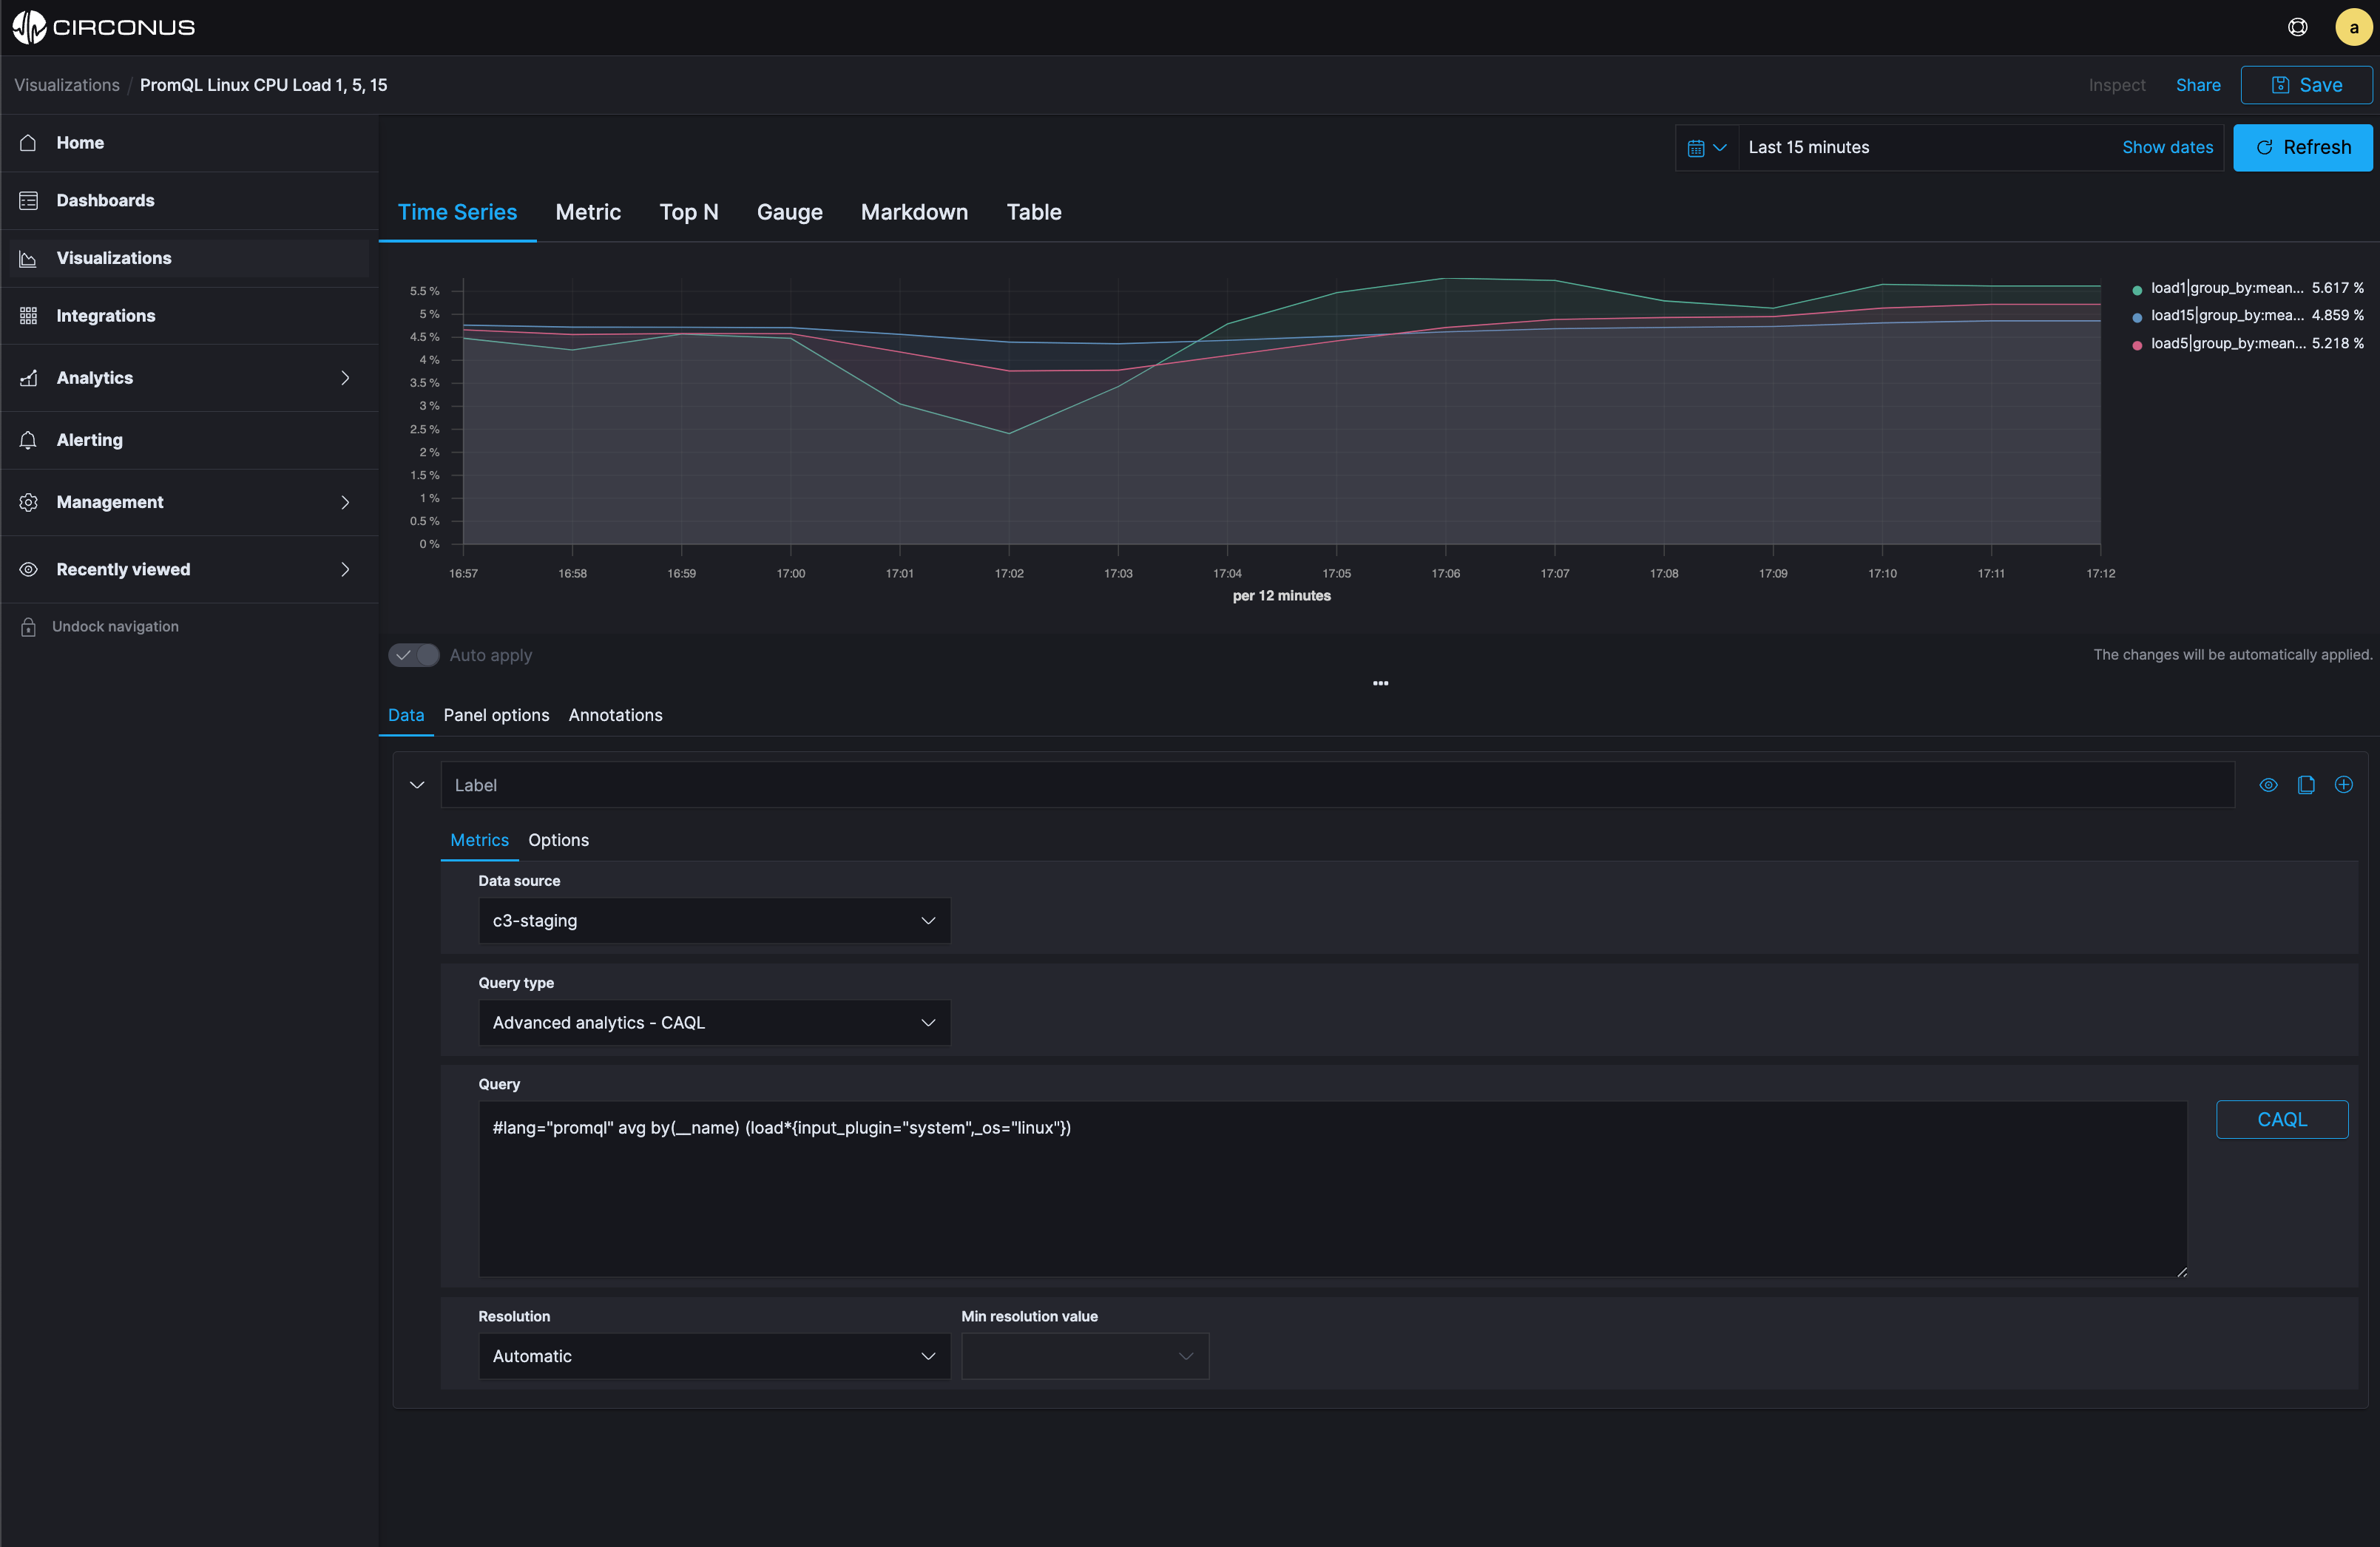
Easily import & migrate
The majority of Prometheus users have built their dashboards in Grafana. If you switch to Circonus, you don’t have to worry about losing all the work you’ve done there. The standard Grafana datasource plugin for Prometheus works with Circonus, so simply point your dashboards to the Circonus datasource. Circonus supports PromQL, allowing your dashboards and queries continue to work as is with no additional effort.
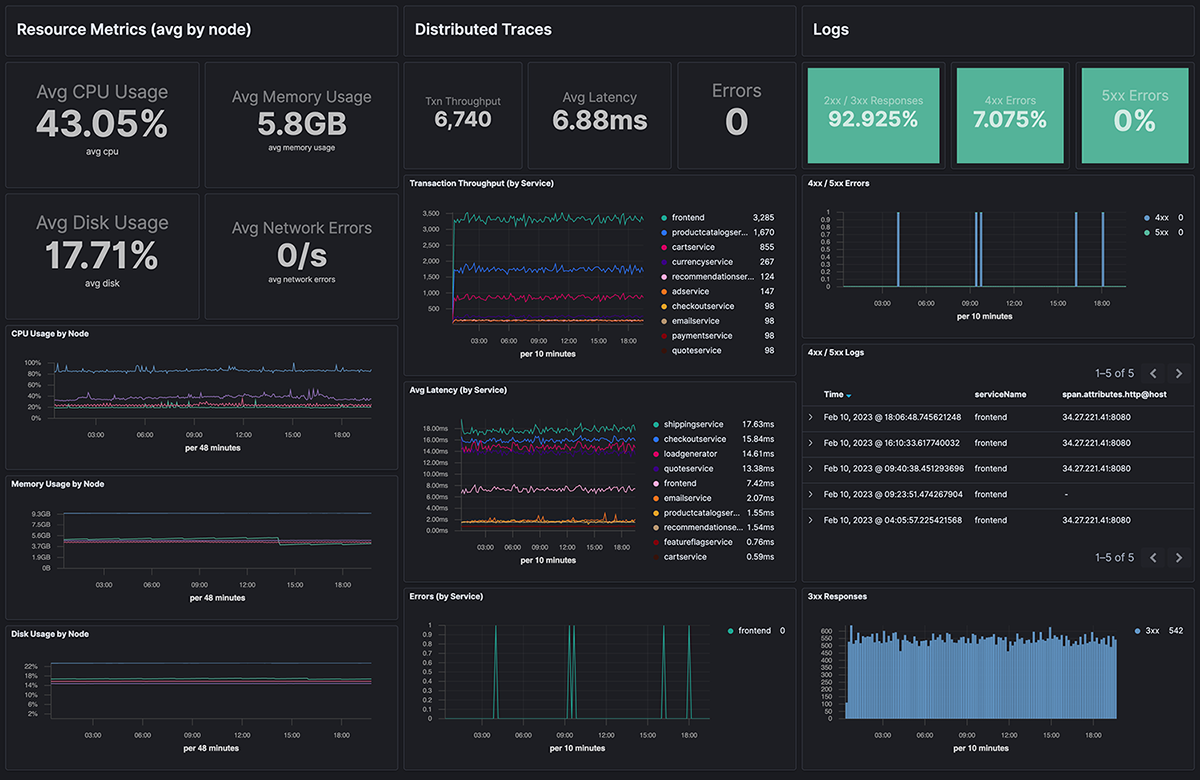
Remove visibility gaps with unified platform
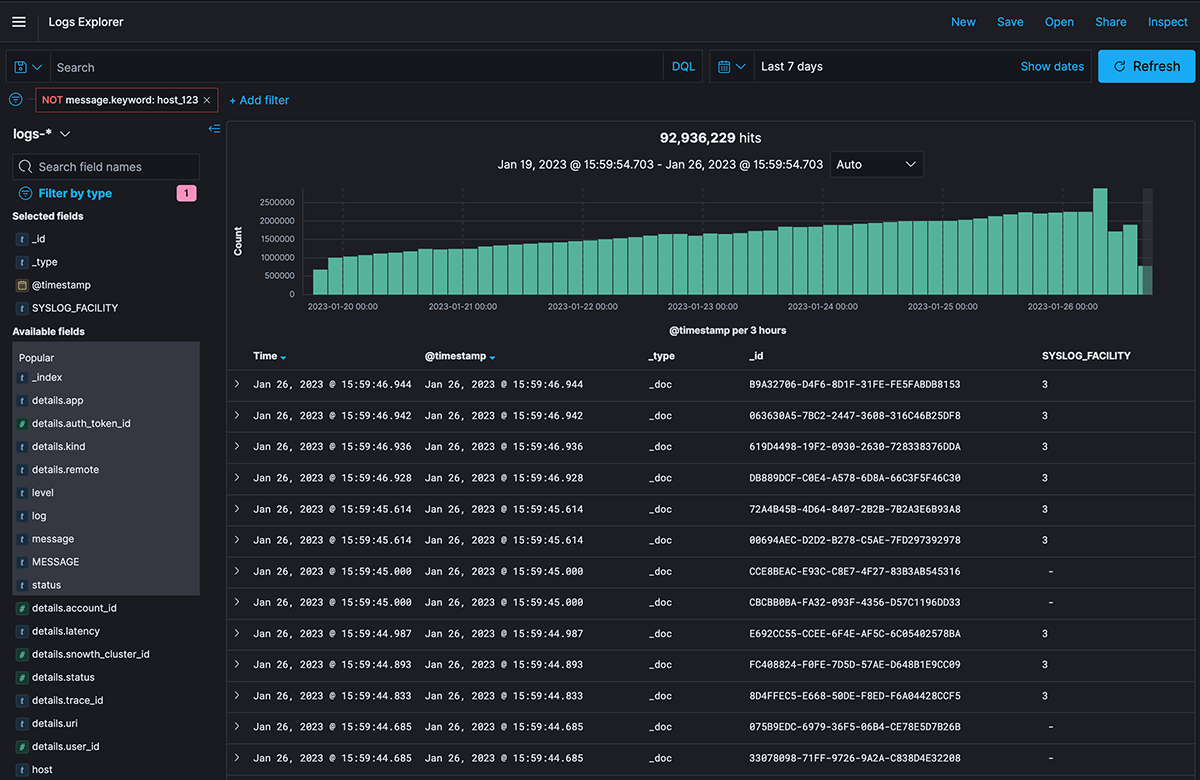
Unlike Prometheus, which requires managing multiple instances and different monitoring tools, Circonus ingests and analyzes logs, metrics, and traces from across your infrastructure, applications, and containers in one platform. As a result, users have the unified, global visibility they need to correlate data, identify emerging issues, and resolve problems faster.
How SREs Can Achieve More Success by Implementing Modern Monitoring
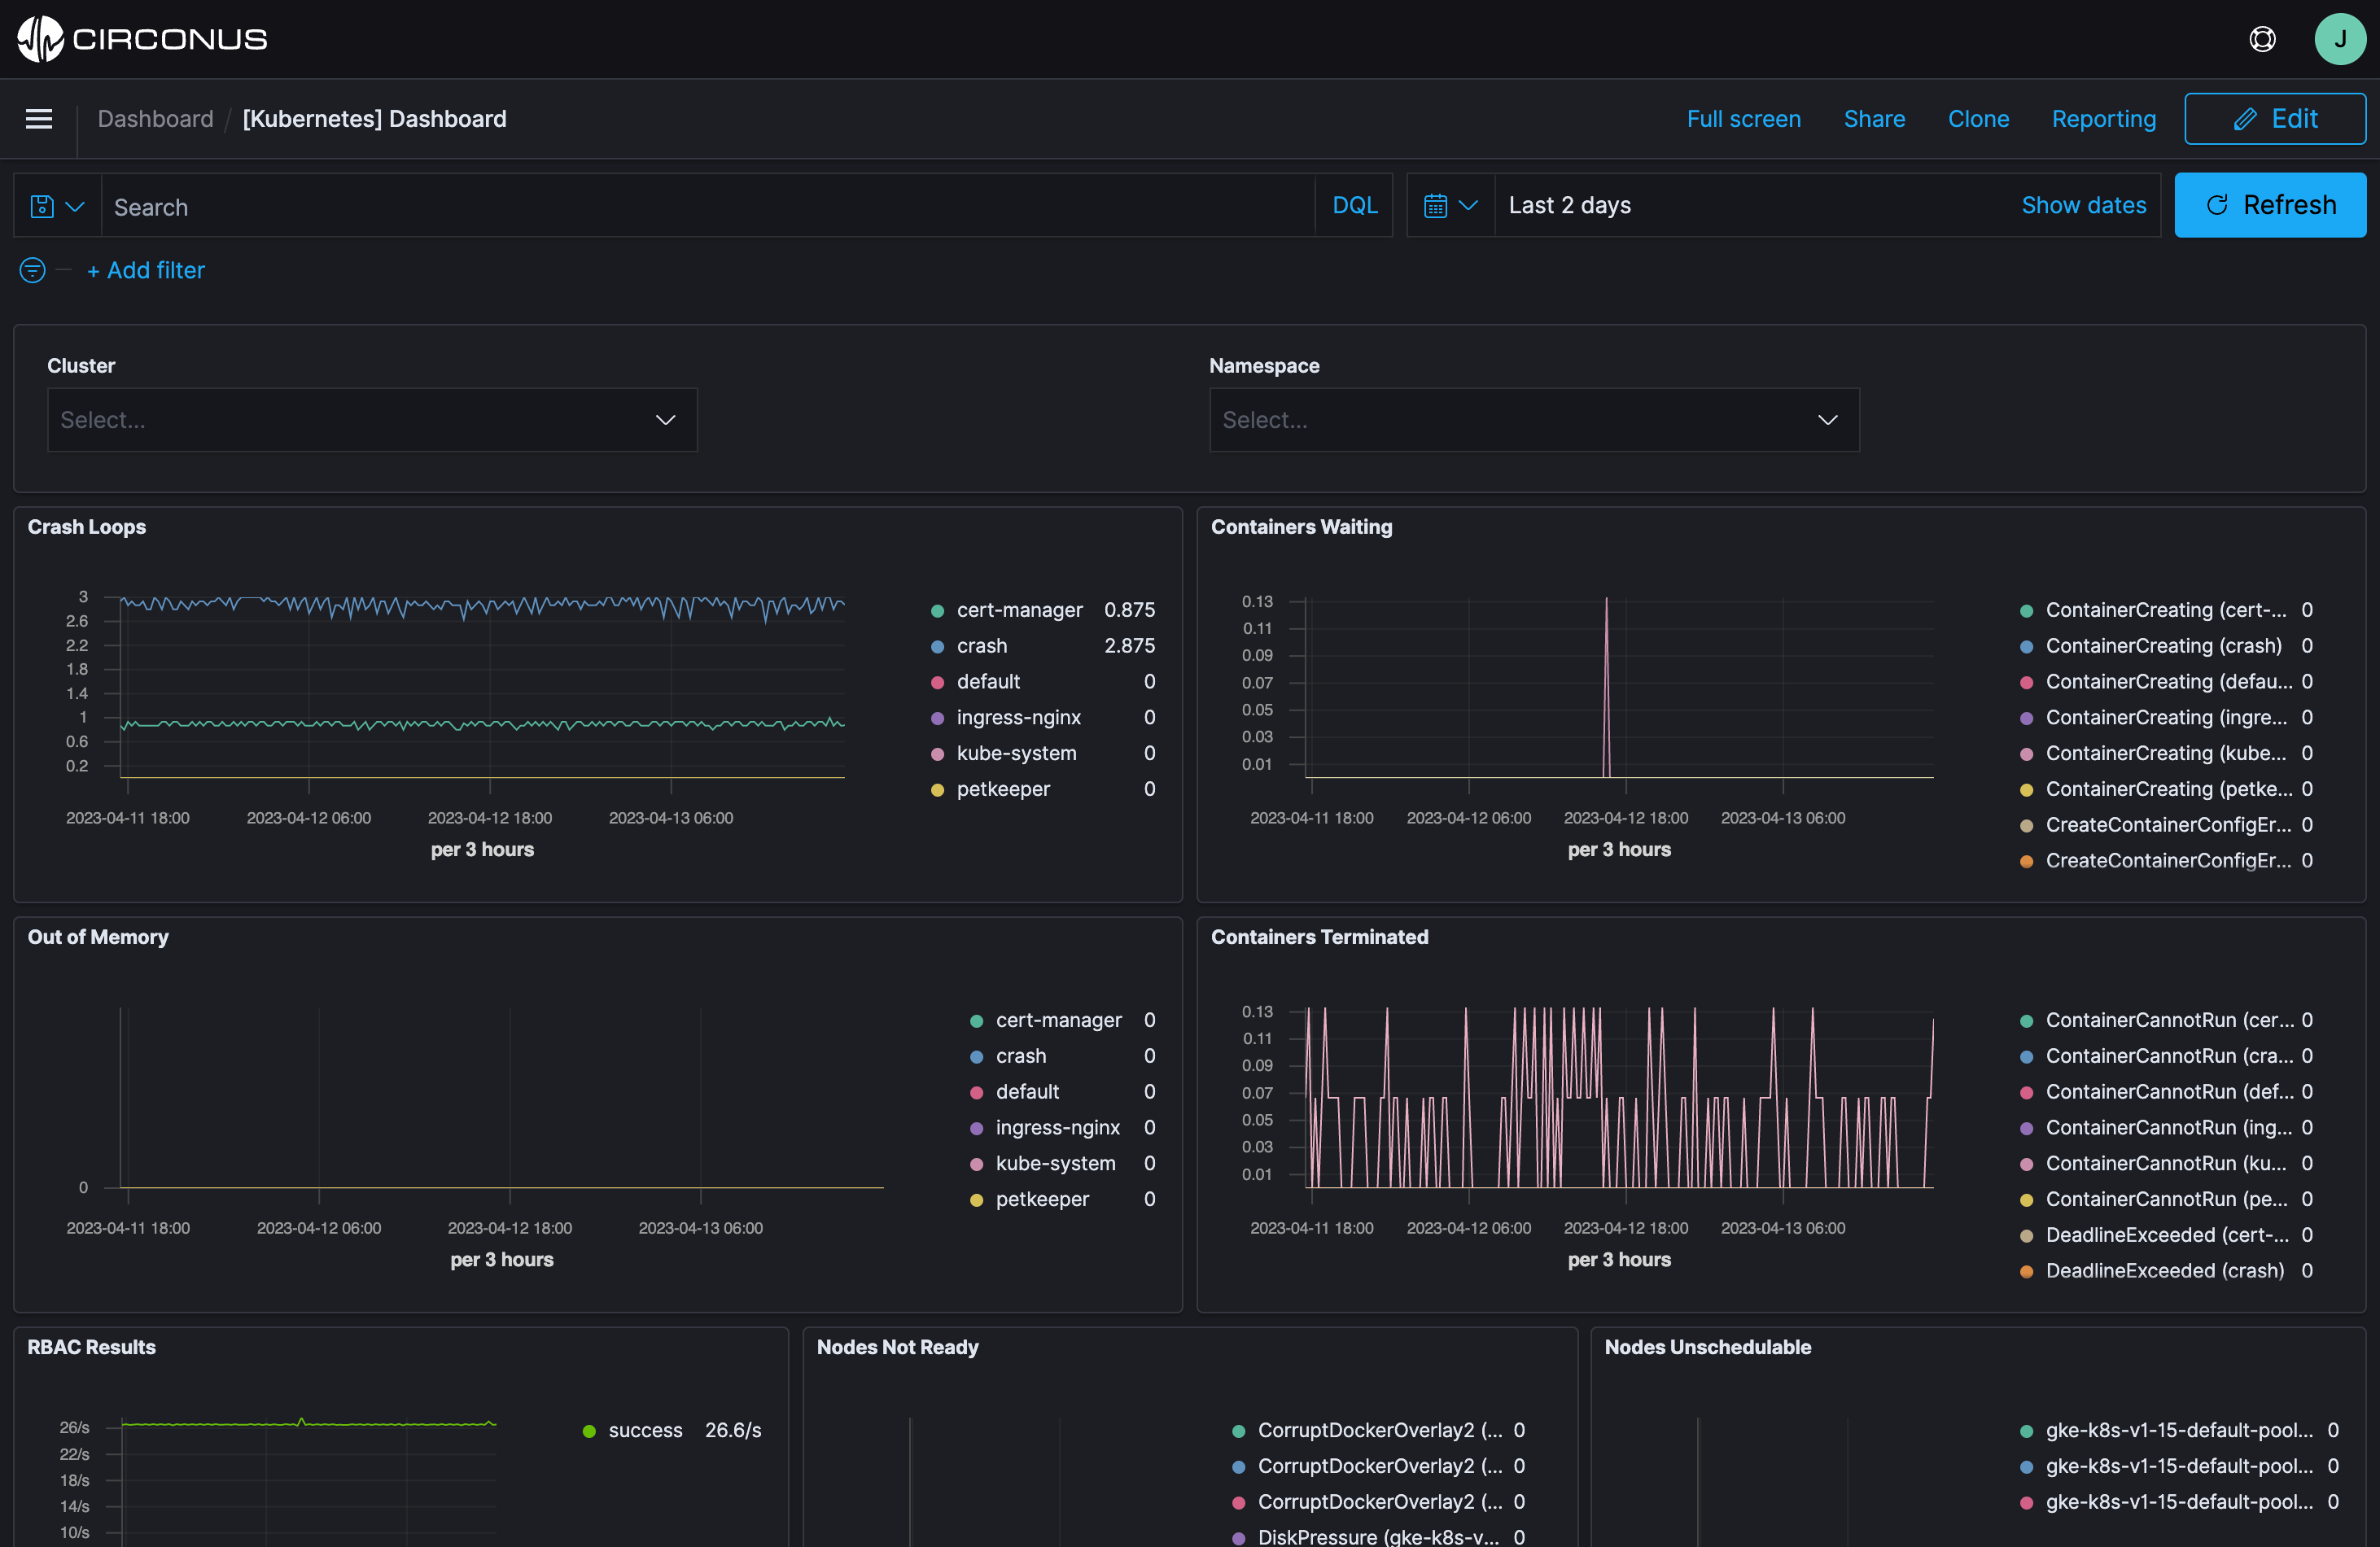
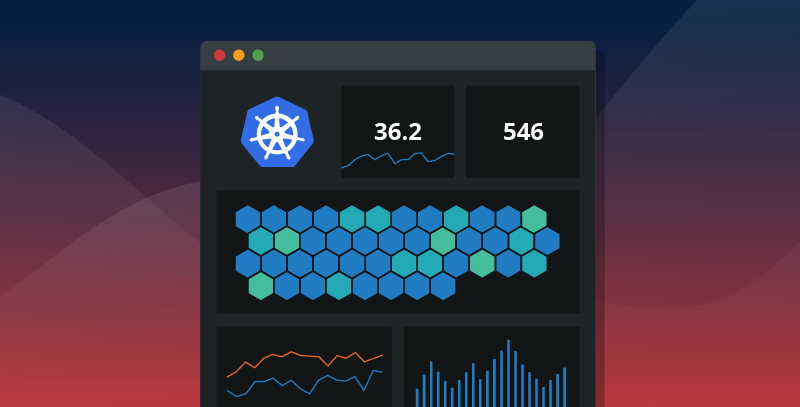
Effortlessly Scale Kubernetes
The typical Prometheus deployment requires that each of your Kubernetes clusters has its own Prometheus instance. This isn’t so bad if you have just a few K8s clusters, but the multicluster model quickly becomes a nightmare as you scale.
With Circonus’ Kubernetes monitoring, you can enjoy unlimited scalability to collect the large volume of high-cardinality data. Drive auto-scaling based on rich historical data analysis with unlimited metric retention, and automatically detect changes — whether it’s a new deployment or new Kubernetes releases — to continue monitoring without interruption.
Gain better performance & insights
Prometheus is a single host that cannot scale as metric count increases. And because Prometheus was never intended to be a long-term storage platform, it is a poor fit for trending or historical data analysis.
The Circonus Platform ingests telemetry at unlimited scale (trillions of measurements per second). As opposed to Prometheus, we do roll-ups of this data and correct math on them to ensure no sacrifice to data accuracy. Our platform also provides infinite retention of this data, enabling users to perform powerful historical data analysis essential for optimizing performance and preventing future issues.
Put simply, Circonus gets it right. The platform’s histograms, dedication to mathematical accuracy, and efficient data storage are the difference in allowing a company to gain the type of business insights that save money, minimize risk, and create better customer experiences.
Jack Neely, Senior Operations Engineer
42 Lines