Guide
Monitoring Kubernetes Health and Performance
by Charlie Fiskeaux II
Despite the popularity of Kubernetes, operating a Kubernetes cluster is challenging. Becoming knowledgeable on this technology, which has layers upon layers of abstractions, takes considerable time. Managing a cluster deployment is difficult, the ecosystem is constantly changing, and best practices are continually evolving.
As a result, Kubernetes monitoring is also complicated. Knowing metrics on cluster health, identifying issues, and figuring out how to remediate problems are common obstacles organizations face, making it difficult to fully realize the benefits and value of their Kubernetes deployment. This guide is divided into three parts:
- Part one explores 3 primary reasons why Kubernetes observability is uniquely challenging, which is critical to understanding how to approach Kubernetes monitoring.
- Part two identifies 12 critical health and performance conditions every Kubernetes operator should be concerned with and defines the 24 types of metrics that need to be collected for you to monitor those conditions.
- Part three details 5 key criteria required for Kubernetes monitoring solutions given the complexity and unique characteristics of Kubernetes.

Part 1: Why Monitoring Kubernetes is So Challenging
Understanding how to best approach monitoring Kubernetes health and performance requires first knowing why Kubernetes observability is uniquely challenging.
Kubernetes’ strength is also one of it’s weaknesses. It abstracts away a lot of complexity to speed deployment; but in doing so, it leaves you blind as to what is actually happening, what resources are being utilized, and even the cost implications of the actions being taken. Also, Kubernetes is more complex than traditional infrastructure, making it much more difficult to do root cause analysis when something goes wrong. The following are three core complexities that make Kubernetes monitoring challenging.
Complexity #1: Millions of Metrics
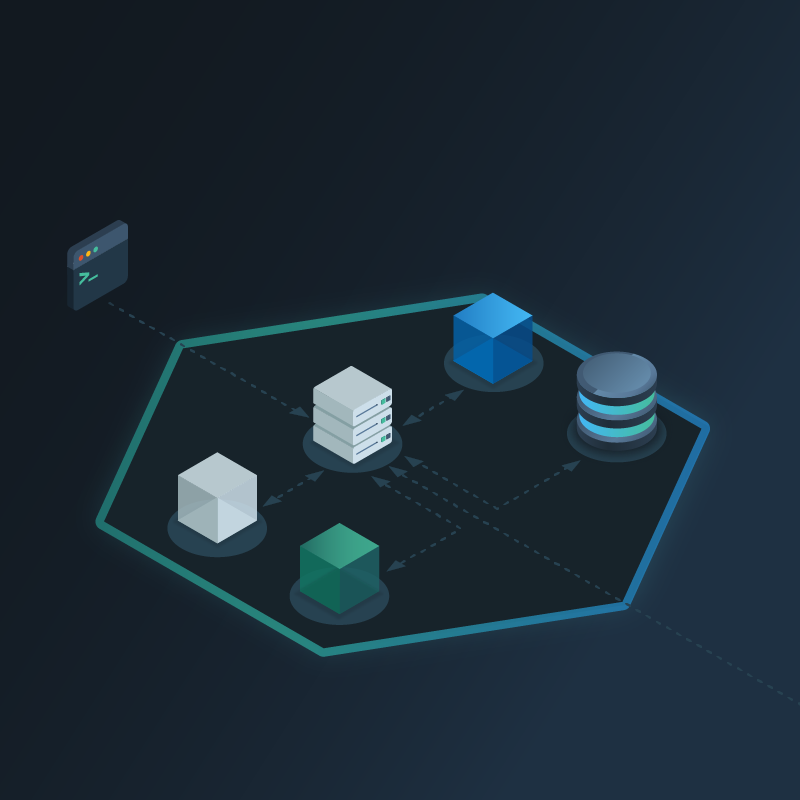
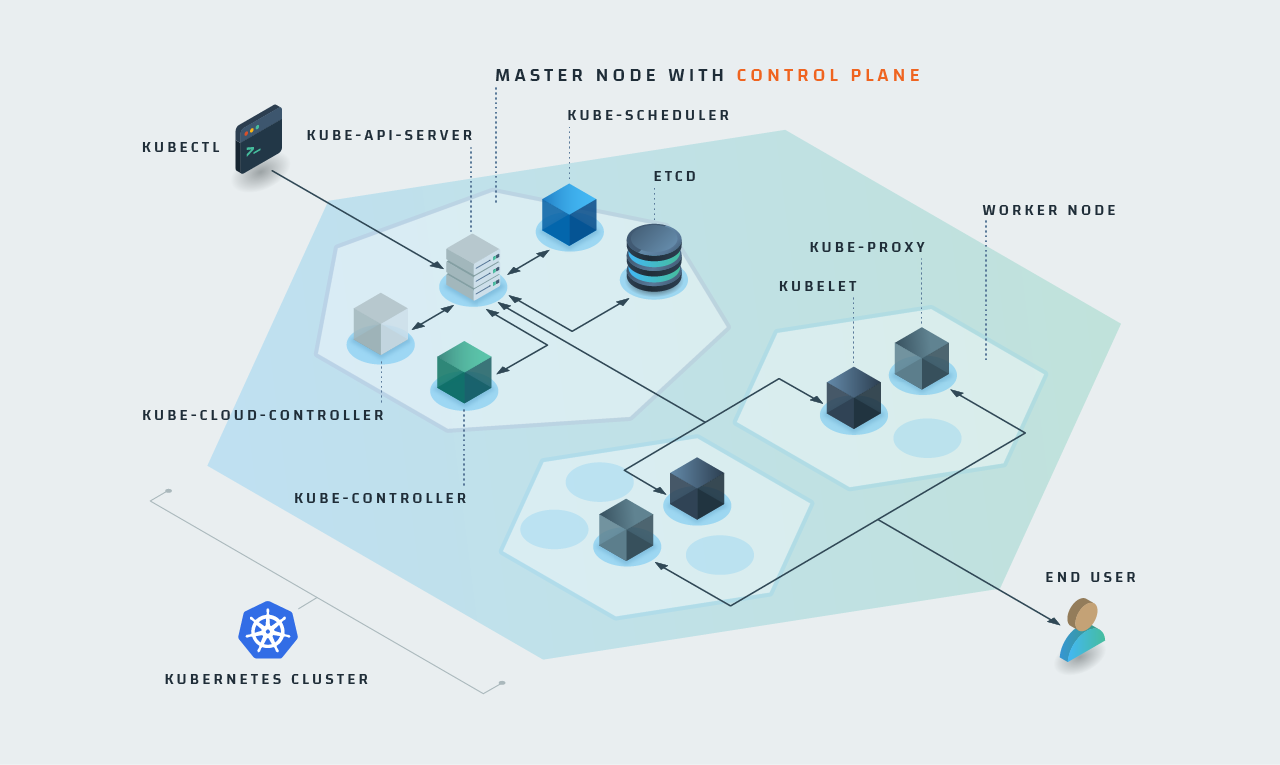
Kubernetes is a multi-layered solution. The entire deployment is a cluster and inside the cluster are nodes. Each node runs one or more pods, which are the main components that handle your containers, and the nodes and pods in turn are managed by the Control Plane. Inside the Control Plane are many smaller pieces such as the kube-controller, cloud-controller, kube-api-server, kube-scheduler, and etcd. These components all work to help Kubernetes efficiently support your container deployments. While they’re all very helpful, they generate a significant number of metrics.
In addition to Control Plane metrics are “Pod Churn” metrics. Real-world pod usage varies widely between different organizations. Some organizations design systems where pods may last days, weeks, or even months; while other organizations have systems where pods only last for minutes or seconds. In Kubernetes, each pod produces a collection of its own metrics. “Pod churn” refers to the cycle through which pods and containers are created, destroyed, and later recreated; and every time a pod is created, you have a new set of metrics being created for it. This results in a large volume of high-cardinality (very unique) metrics. A high level of “pod churn” can result in millions upon millions of new metrics being created every single day.
Complexity #2: Ephemerality
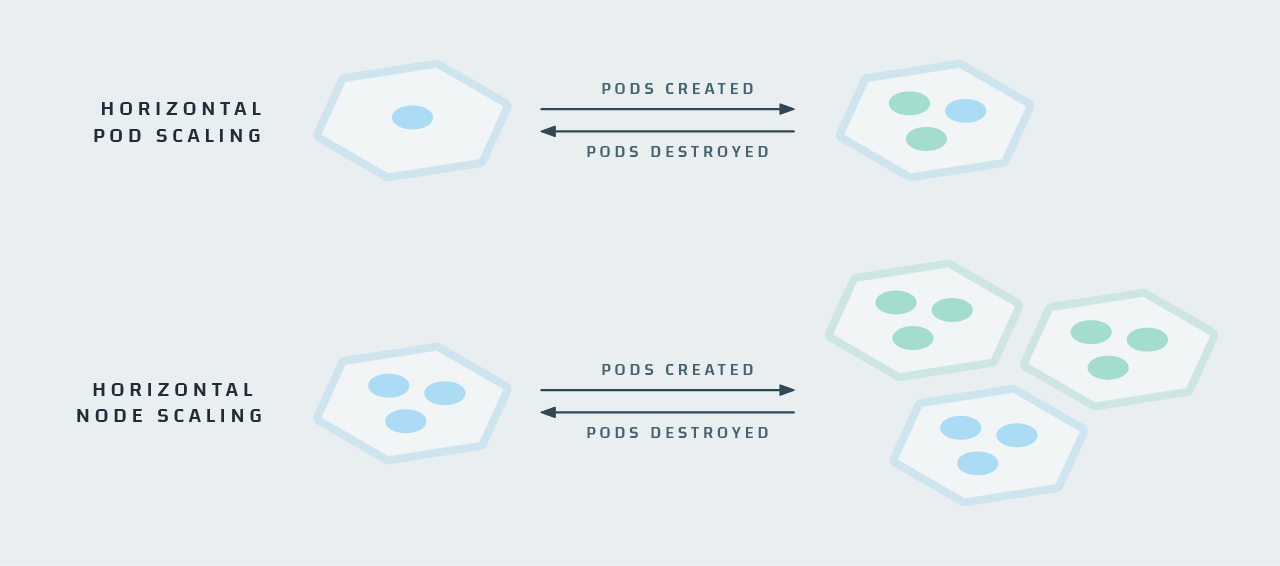
In addition to the system Control Plane, there are your deployment elements — which constantly change. Deployments, DaemonSets, Jobs and StatefulSets all can generate new pods to monitor, and sometimes it’s even necessary to scale down; then pods or nodes will disappear forever. The Kubernetes scheduler schedules pod deployments to ensure that resources are always available and allocated where you want them to be. As new deployments are scheduled, Kubernetes may decide that it needs to move a pod in order to free up resources on a given node. This results in pods being moved and recreated — the same pod, just with a different name and in a different place.
Complexity #3: Lack of Observability
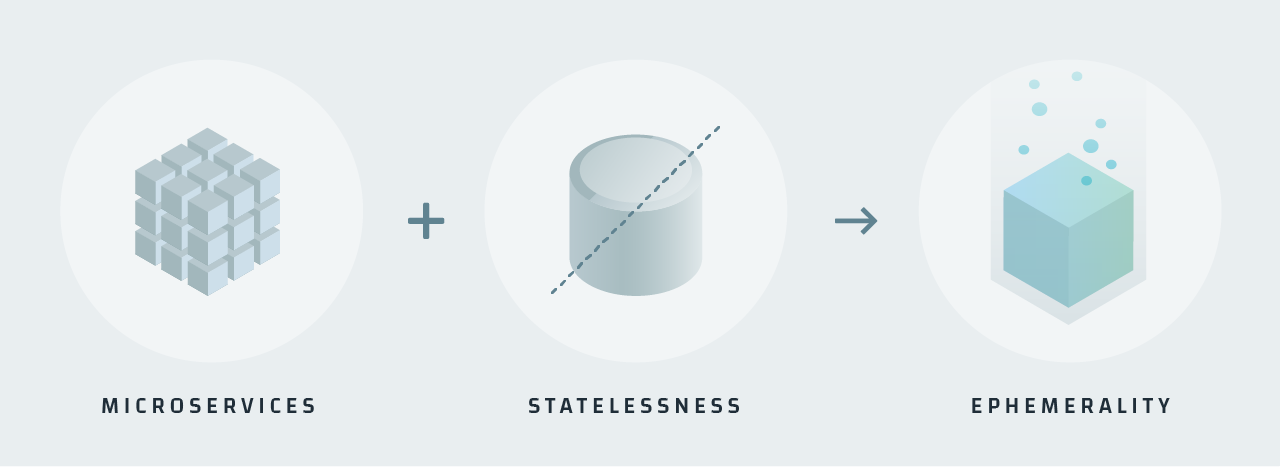
Organizations that adopt Kubernetes tend to also follow modern software practices, including using microservices and/or stateless application design. These ultimately lead to application architectures that are very dynamic and hinder observability.
In a microservice-based application, engineers break down the application into components representing the core functions or services of the application. These components are intended to be loosely coupled, so the services are operated independently and designed in such a way that a change to one service won’t significantly affect other services. Modern applications can be composed of dozens of microservices, and Kubernetes keeps track of the state of these various components, ensuring they are available and that there are enough of them to handle the appropriate workload. The microservices themselves are in constant communication with each other, and that communication takes place through a virtual network within the Kubernetes cluster itself.
In a stateless application, the application avoids storing any client session data on the server. Any session data storage (if it needs to occur at all) is handled on the client side. Since there is no session data stored on the server, there is also no need for any particular client connection to be favored over any other client connection. This allows the application to treat each connection as the first connection and easily balance the processing load across multiple instances. The biggest benefit of stateless application design is that it enables applications to be horizontally scaled, simply by deploying instances of the application on multiple servers and then distributing all incoming client requests amongst the available servers.
Microservices are not required to be stateless (and stateless apps are not required to be organized into microservices), but you do tend to find these two practices being leveraged together for the sake of being able to easily scale the application. This means Kubernetes becomes an ideal platform upon which to deploy this type of software. However, these types of services are (by design) expected to be ephemeral; they scale up to handle a workload and subsequently disappear when no longer needed. As a result, all operational information present within a pod disappears with it when it’s torn down. Nothing is left; it’s all gone.
How does this affect the observability of Kubernetes? Since observability is the ability to infer the state of a system through knowledge of that system’s outputs, it sure seems like Kubernetes is a system with minimal observability. This limited observability is why it’s so difficult to troubleshoot problems with Kubernetes. It’s not uncommon to hear stories of Kubernetes operators finding major software problems months or even years after having migrated to the ecosystem. Kubernetes itself does such a fantastic job of ensuring that services stay running, that given its limited outputs you can easily find yourself in just such a situation without realizing it. On the surface, this is a great success story for Kubernetes, but sooner or later those software problems need to be found, and that’s going to be a problem when the system seems to be a “black box.”

Part 2: 12 Critical Kubernetes Health Conditions to Monitor & The 24 Metrics You Need to Collect
Kubernetes can generate so many types of new metrics that one of the most challenging aspects of monitoring your cluster’s health is filtering through these metrics to decide which ones are important to collect and pay attention to.
In fact, in a recent survey that Circonus conducted of Kubernetes operators, uncertainties around which metrics to collect was one of the top challenges to monitoring that operators face. This isn’t surprising, given the millions of metrics that Kubernetes can generate on a daily basis.
The following sections identify the health metrics that are most critical for Kubernetes operators to collect and analyze. These metrics are organized by their source (there are three sources of health metrics in total). Each source includes the name and definitions of its metrics and which health conditions these metrics are associated with that operators should monitor and alert on.
Source #1: Resource and Utilization Metrics
The first source of health data is resource and utilization metrics, which come from the built-in metrics API and are provided by the kubelets themselves. These metrics include: Resource and Utilization metrics are associated with the following health conditions to monitor and alert on:
| Metric | Name | Description |
|---|---|---|
| CPU Usage | usageNanoCores |
The number of CPU cycles used per second for a node or pod (divided into billionths of a second). |
| CPU Capacity | capacity_cpu |
The number of CPU cores available on a node (not available for pods). |
| Memory Usage | used{resource:memory,units:bytes} |
The amount of memory used by a node or pod, in bytes. |
| Memory Capacity | capacity_memory{units:bytes} |
The total memory available for a node (not available for pods), in bytes. |
| Network Traffic | rx{resource:network,units:bytes} tx{resource:network,units:bytes} |
The total network traffic seen for a node or pod, both received (incoming) traffic and transmitted (outgoing) traffic, in bytes. |
High CPU
This is the easiest to understand: you should track how many CPU cycles your nodes are using. This is important to monitor for two reasons: first, you don’t want to run out of processing resources for your application. If your application becomes CPU-bound, you need to increase your CPU allocation or add more nodes to the cluster. Second, you don’t want your CPU to sit there unused. If your CPU usage is consistently low, you may have over-allocated your resources and are potentially wasting money. You should compare utilization{resource:cpu} to a pre-decided threshold over a particular window of time (e.g. has it stayed over the threshold for over 5 minutes) to determine if your CPU usage is getting too high.
Metric to watch:
usageNanoCores
Source #2: State Metrics
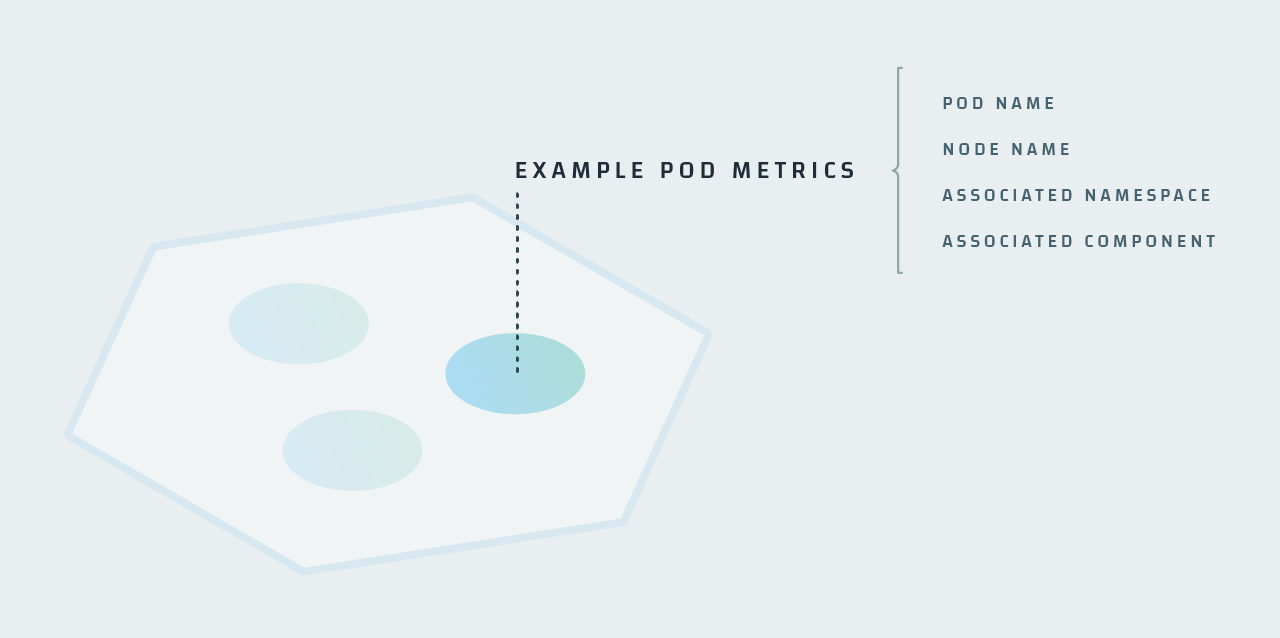
The second source of health data is the kube-state-metrics component (an optional installation), which provides most of the crucial metrics. kube-state-metrics is a component that provides data on the state of cluster objects (nodes, pods, DaemonSets, namespaces, et al). It serves its metrics through the same metrics API from which the resource and utilization metrics are served. These metrics include:
State Health Conditions
State health metrics are associated with the following health conditions to monitor and alert on:
| Metric | Name | Description |
|---|---|---|
| Node Status | kube_node_status_condition{status:true,condition:OutOfDisk|MemoryPressure|PIDPressure|DiskPressure|NetworkUnavailable} |
A numeric boolean (0 or 1) for each node/condition combination, indicating if that node is currently experiencing that condition. |
| Crash Loops | kube_pod_container_status_waiting_reason{reason:CrashLoopBackOff} |
A numeric boolean (0 or 1) for each container, indicating if it’s experiencing a crash loop. |
| Job Status (Failed) | kube_job_status_failed |
A numeric boolean (0 or 1) for each job, indicating if it has failed. |
| Persistent Volume Status (Failed) | kube_persistentvolume_status_phase{phase:Failed} |
A numeric boolean (0 or 1) for each persistent volume, indicating if it has failed. |
| Pod Status (Pending) | kube_pod_status_phase{phase:Pending} |
A numeric boolean (0 or 1) for each pod indicating if it’s in a pending state. |
| Latest Deployment Generation | kube_deployment_metadata_generation |
Sequence number representing the latest generation of a Deployment. |
| Observed Deployment Generation | kube_deployment_status_observed_generation |
Sequence number representing the current generation of a Deployment as observed by the controller. |
| Desired DaemonSet Nodes | kube_daemonset_status_desired_number_scheduled |
Number of nodes that should be running each pod in the DaemonSet. |
| Current DaemonSet Nodes | kube_daemonset_status_current_number_scheduled |
Number of nodes that are running each pod in the DaemonSet. |
| Desired StatefulSet Replicas | kube_statefulset_status_replicas |
Number of replicas desired per StatefulSet. |
| Ready StatefulSet Replicas | kube_statefulset_status_replicas_ready |
Number of replicas which are ready per StatefulSet. |
Crash Loops
A crash loop is when a container starts, crashes, and kube-scheduler keeps trying to restart it but can’t (so it keeps crashing and restarting in a loop). This can be caused either by an application within the container crashing, or by a misconfiguration in the deployment process, which makes debugging a crash loop rather tricky. Crash loops are obviously bad because they may render your services unreachable. However, sometimes clusters have hidden crash loops — Kubernetes is so good at its job that crash loops may be occurring — yet your application continues to be available. Even in a best case scenario, the crash loop is wasting CPU cycles, which may impact your cluster provisioning and waste money. When a crash loop happens, you need to know quickly so that you can figure out what’s happening and whether you need to take emergency measures to keep your application available. Summing all of your kube_pod_container_status_waiting_reason{reason:CrashLoopBackOff} metrics will give you a total of how many crash loops you currently have happening, and they’re also tagged with the names of the containers which are crashing as well.
Metric to watch:
kube_pod_container_status_waiting_reason{reason:CrashLoopBackOff}
Disk Pressure
Disk pressure is a condition indicating that a node is using too much disk space or is using disk space too fast, according to the thresholds you have set in your Kubernetes configuration (this is pertaining to the disk space on the node itself, not on other volumes like PersistentVolumes). This is important to monitor because it might mean that you need to add more disk space, if your application legitimately needs more space. Or it might mean that an application is misbehaving and filling up the disk prematurely in an unanticipated manner. Either way, it’s a condition that needs your attention.
Metric to watch:
kube_node_status_condition{status:true,condition:DiskPressure}
Memory Pressure
Memory pressure is another resourcing condition indicating that your node is running out of memory. Similar to CPU resourcing, you don’t want to run out of memory — but you also don’t want to over-allocate memory resources and waste money. You especially need to watch for this condition because it could mean there’s a memory leak in one of your applications.
Metric to watch:
kube_node_status_condition{status:true,condition:MemoryPressure}
PID Pressure
PID pressure is a rare condition where a pod or container spawns too many processes and starves the node of available process IDs. Each node has a limited number of process IDs to distribute amongst running processes; and if it runs out of IDs, no other processes can be started. Kubernetes lets you set PID thresholds for pods to limit their ability to perform runaway process-spawning, and a PID pressure condition means that one or more pods are using up their allocated PIDs and need to be examined.
Metric to watch:
kube_node_status_condition{status:true,condition:PIDPressure}
Network Unavailable
All your nodes need network connections, and this status indicates that there’s something wrong with a node’s network connection. Either it wasn’t set up properly (due to route exhaustion or a misconfiguration), or there’s a physical problem with the network connection to your hardware.
Metric to watch:
kube_node_status_condition{status:true,condition:NetworkUnavailable}
Job Failures
Jobs are designed to run pods for a limited amount of time and tear them down when they’ve completed their intended functions. If a job doesn’t complete successfully due to a node crashing or being rebooted, or due to resource exhaustion, you need to know that the job failed. That’s why you need to monitor job failures — they don’t usually mean your application is inaccessible, but if left unfixed it can lead to problems down the road. Summing all of your kube_job_status_failed metrics will give you a total of how many jobs are currently failing.
Metric to watch:
kube_job_status_failed
Persistent Volume Failures
Persistent Volumes are storage resources that are specified on the cluster and are available as persistent storage to any pod which requests it. During their lifecycle, they are bound to a pod and then reclaimed when no longer needed by that pod. If that reclamation fails for whatever reason, you need to know that there’s something wrong with your persistent storage. Summing all of your kube_persistentvolume_status_phase{phase:Failed} metrics will give you a total of how many persistent volumes are currently failing.
Metric to watch:
kube_persistentvolume_status_phase{phase:Failed}
Pod Pending Delays
During a pod’s lifecycle, its state is “pending” if it’s waiting to be scheduled on a node. If it’s stuck in the “pending” state, it usually means there aren’t enough resources to get the pod scheduled and deployed. You will need to either update your CPU and memory allocations, remove pods, or add more nodes to your cluster. You should watch your kube_pod_status_phase{phase:Pending} metrics over a particular window of time (e.g. has a pod stayed pending for over 15 minutes) to determine if you’re having pod scheduling problems.
Metric to watch:
kube_pod_status_phase{phase:Pending}
Deployment Glitches
Deployments are used to manage stateless applications — where the pods are interchangeable and don’t need to be able to reach any specific single pod, but rather just a particular type of pod. You need to keep an eye on your Deployments to make sure they finish properly. The best way is to make sure the latest Deployment Generation matches the observed Deployment Generation. If there’s a mismatch, then one or more Deployments has likely failed and not been rolled back.
Metrics to watch:
kube_deployment_metadata_generation
kube_deployment_status_observed_generation
DaemonSets Not Ready
DaemonSets are used to manage the services or applications that need to be run on all nodes in a cluster. If you have a log collection daemon or monitoring service that you want to run on every node, you’ll want to use a DaemonSet. Monitoring is similar to that of deployments: you need to make sure that the number of desired DaemonSet Nodes matches the number of current DaemonSet Nodes. If there’s a mismatch, then one or more DaemonSets has failed to fully deploy.
Metrics to watch:
kube_daemonset_status_desired_number_scheduled
kube_daemonset_status_current_number_scheduled
StatefulSets Not Ready
StatefulSets are used to manage stateful applications, where the pods have specific roles and need to reach other specific pods; rather than just needing a particular type of pod, as with deployments. Monitoring is similar, though — you need to make sure that the number of desired StatefulSet Replicas matches the number of ready StatefulSet Replicas. If there’s a mismatch, then one or more StatefulSets has failed to fully deploy.
Metrics to watch:
kube_statefulset_status_replicas
kube_statefulset_status_replicas_ready
Source #3: Control Plane Metrics
The third source of health data is the Control Plane. The Kubernetes Control Plane encompasses the portions of Kubernetes that are considered “system components” for helping with cluster management. In a managed environment like Google or Amazon provide, the Control Plane is managed by the cloud provider and you typically don’t have to worry about monitoring these metrics. However, if you manage your own cluster, you’ll want to know how to monitor your Control Plane. When they’re available, most of these metrics can be found via the metrics API. These metrics include:
| Metric | Name | Description |
|---|---|---|
| etcd Leader | etcd_server_has_leader |
A numeric boolean (0 or 1) for each etcd cluster member, indicating whether that member knows who its leader is. |
| etcd Leader Changes | etcd_server_leader_changes_seen_total |
The count of the total number of leader changes which have happened in the etcd cluster. |
| API Latency Count | apiserver_request_latencies_count |
The count of the total number of API requests; used to calculate average latency per request. |
| API Latency Sum | apiserver_request_latencies_sum |
The total of all API request durations; used to calculate average latency per request. |
| Queue Waiting Time | workqueue_queue_duration_seconds |
The total time that action items have spent waiting in each of the controller manager’s work queues. |
| Queue Work Time | workqueue_work_duration_seconds |
The total time that has been taken to process action items from each of the controller manager’s work queues. |
| Unsuccessful Pod Scheduling Attempts | scheduler_schedule_attempts_total{result:unschedulable} |
The total number of attempts made by the scheduler to schedule pods on nodes which ended up being unsuccessful. |
| Pod Scheduling Latency | scheduler_e2e_scheduling_latency_microseconds (< v1.14) or scheduler_e2e_scheduling_duration_seconds |
The total length of time that has been taken to schedule pods onto nodes. |
Control Plane Health Conditions
Control Plane health metrics are associated with the following health conditions to monitor and alert on:
etcd Leaders
The etcd cluster should always have a leader (except during the process of changing leaders, which should be infrequent). You should keep an eye on all of your etcd_server_has_leader metrics because if too many cluster members don’t recognize their leader, your cluster performance will be degraded. Also, if you’re seeing a high number of leader changes reflected in etcd_server_leader_changes_seen_total, it could indicate issues with connectivity or resourcing in the etcd cluster.
Metrics to watch:
etcd_server_has_leader etcd_server_leader_changes_seen_total
API Request Latency
If you divide apiserver_request_latencies_count into apiserver_request_latencies_sum you’ll get your API server’s average latency per request. Tracking the average request latency over time can let you know when your server is getting overwhelmed.
Metrics to watch:
apiserver_request_latencies_count
apiserver_request_latencies_sum
Work Queue Latency
The work queues are action queues managed by the controller manager, and are used to handle all automated processes in the cluster. Watching for increases in either workqueue_queue_duration_seconds or workqueue_work_duration_seconds will let you know when the queue latency is increasing. If this happens, you may want to dig into the controller manager logs to see what’s going on.
Metrics to watch:
workqueue_queue_duration_seconds
workqueue_work_duration_seconds
Scheduler Problems
There are two aspects of the scheduler that are worth watching. First, you should monitor scheduler_schedule_attempts_total{result:unschedulable} because an increase in unschedulable pods may mean you have a resourcing issue with your cluster. Second, you should keep an eye on the scheduler latency using one of the latency metrics indicated above (the metric name and units changed with v1.14). An increase in pod scheduling latency may cause other problems, and may also indicate resourcing issues in your cluster.
Metrics to watch:
scheduler_schedule_attempts_total{result:unschedulable}
scheduler_e2e_scheduling_latency_microseconds or scheduler_e2e_scheduling_duration_seconds (see table above)
Events and Application Metrics
In addition to collecting numeric metrics from your Kubernetes cluster, collecting and tracking events and applications from your cluster can also be useful. Cluster events will let you monitor the pod lifecycle and watch for significant pod failures, and watching the rate of events flowing from your cluster can be an excellent early warning indicator. If the rate of events changes suddenly or significantly, it may be an indicator that something is going wrong.
Unlike the rest of the metrics and events examined above, application metrics aren’t emitted from Kubernetes itself, but rather from your workloads which are run by the cluster. This telemetry can be anything that you consider important from the point of view of your application: error responses, request latency, processing time, etc.
There are two philosophies of how to collect application metrics. The first (which has been widely preferred until recently) is that metrics should be “pushed” out from the application to a collection endpoint. This means a client like StatsD has to be bundled with each application to provide a mechanism with which to push metric data out of that application. This technique requires more management overhead to ensure every application running in your cluster is instrumented properly, so it’s begun falling out of favor with cluster managers.
The second metric collection philosophy (which is becoming more widely adopted) is that metrics should be “pulled” from applications by a collection agent. This makes applications easier to write because all they have to do is publish their metrics appropriately, but the application doesn’t have to worry about how those metrics are pulled or scraped. This is how OpenMetrics works and is the way Kubernetes cluster metrics are collected. When this technique is combined with service discovery by your collection agent, it creates a powerful method for collecting any kind of metrics you need from your cluster applications.

Part 3: What to look for in a Kubernetes monitoring solution
The challenges of Kubernetes directly impact what you should look for in a monitoring solution, and the solution you choose will have direct implications for achieving Kubernetes success.
Managing the complexities of Kubernetes observability requires knowing what to look for in a monitoring solution. While there are several open source Kubernetes monitoring solutions, they require you to create and install several individual components before you can meaningfully monitor your cluster. Several traditional IT monitoring tool providers have also introduced Kubernetes monitoring solutions, but many are not purpose-built for Kubernetes. As a result, organizations are required to do more tuning and spend considerable time identifying problems, what’s causing them, and how to fix them.
So how do you identify what’s best for you? The following are 5 key criteria to consider when evaluating Kubernetes monitoring solutions.
Criteria #1: The monitoring solution should adapt to changes automatically yet keep a consistent user experience
Due to the ephemeral nature of Kubernetes, a monitoring solution needs the ability to detect changes automatically and continue monitoring without interruption. Also, Kubernetes itself is constantly changing. There’s a new release once every six weeks or so — releases which often include significant (and sometimes breaking) changes. This can create a ripple-effect throughout the Kubernetes ecosystem, with other tools and technologies now needing to adjust as well. The goal of a good Kubernetes monitoring solution should be to keep up with and encapsulate these changes in a way that still provides a consistent, reliable, and repeatable experience for the user — thus removing the burden from them.
Criteria #2: The monitoring solution should offer turnkey tools built specifically for Kubernetes
If you’re monitoring Kubernetes, it’s your job to identify problems, the cause of failure, and the steps to quick remediation. This requires developing appropriate domain knowledge, including a discrete set of pathological failures and prescriptive responses to each of them. But when you look at the Kubernetes skills available in the market today, you’ll see that this sort of knowledge is extremely rare.
An effective Kubernetes monitoring solution should address this skills gap by providing turnkey, pre-configured Kubernetes capabilities for identifying and remediating recurrent, specific failures seen in Kubernetes deployments — like crash loops, job failures, CPU utilization, etc. Users should not need to figure out which of these they need to monitor and how. The solution should make you aware of the problem, but not require time-consuming learning and deep analysis to track it, deal with it, and ensure it doesn’t happen again. These capabilities should also be purpose-built for Kubernetes – so metrics and analysis are specific to Kubernetes.
For example, at Circonus, we provide pre-configured health dashboards and alerts for the 12 health conditions that most commonly afflict clusters. Automatic alert rules are based on health and performance criteria specific to Kubernetes, and step-by-step remediation instructions help operators fix common problems. Organizations can therefore easily automate their monitoring and have peace of mind that they will be aware of significant issues and how to address them.
Several traditional IT monitoring tool providers have also introduced Kubernetes monitoring solutions. These solutions, however, do not provide turnkey, purpose-built capabilities. As a result, organizations are required to do more alert tuning and spend considerable time identifying problems, root causes, and remediation steps.
Criteria #3: The monitoring solution should handle a lot of data and know which metrics are important to pay attention to
Kubernetes can generate millions upon millions of new metrics daily. This can present two big challenges. First, many conventional monitoring systems just can’t keep up with the sheer volume of unique metrics needed to properly monitor Kubernetes clusters. Second, all this data “noise” makes it hard to keep up with and know which metrics are most important.
A comprehensive Kubernetes monitoring solution must have the ability to handle all of this data, as well as automatically analyze, graph, and alert on the most critical metrics to pay attention to. This way, you know you’ve collected everything you need, filtered out the unnecessary data, and narrowed in on the most relevant data. As a result, you can save substantial time and rest assured everything is working as it should.
Criteria #4: The monitoring solution should provide visibility into resource utilization to reduce costs and improve application performance
Overprovisioning clusters is a common problem in Kubernetes. In fact, most organizations have wasted resources in their clusters that they’re unaware of. A monitoring solution that provides insights into resource utilization and key application performance metrics is important in helping prevent this.
What’s challenging to understand is how much CPU and RAM your pods are requesting versus how much are they actually using. It’s important to be able to obtain this information and make decisions about your expenditures based on what you’re actually using.
Also, if you’re only monitoring Kubernetes itself and not gaining insight into the applications that are being run there, you’re only seeing half the picture. In addition to understanding the amount of CPU, memory, network and storage that each of the pods are taking up, you also want to monitor the underlying application metrics that matter to your organization, whether that’s requests per second, new users per minute, etc.
Most organizations overestimate the resources needed to keep their clusters running optimally. If you do a bit more digging into resource utilization metrics, you might see that you’re not using the resources you thought you were — so there’s a huge opportunity for cost savings.
Criteria #5: The monitoring solution should enable speedy deployment of new features and products
While there are several open-source Kubernetes monitoring solutions presently available, they require you to install and configure multiple components before you can meaningfully monitor your cluster. And even if you are able to do this to start, monitoring is an iterative process so you will need to constantly make adjustments.
Reducing deployment time is a top reason organizations choose to use Kubernetes, and monitoring solutions that require time-consuming setup and analysis will reduce this benefit. That’s why your Kubernetes monitoring solution should be quick to install. For example, Circonus can be up and running quickly, populating graphs with data in less than 10 minutes.

Conclusion
Rarely has a new technology seen explosive growth as Kubernetes has over the past few years. Its capabilities are robust and beneficial for modern cloud-based applications, and yet it is different enough from traditional server architectures that it has created the need for a new approach to monitoring. Kubernetes presents unique observability challenges, and conventional monitoring techniques are not enough to gain insights into cluster health and resource allocation.
The inherent complexities of Kubernetes drive the need for turnkey, purpose-built Kubernetes monitoring solutions. Only with a comprehensive yet automated, easy-to-use monitoring platform can organizations really unlock the full value of their Kubernetes deployments. Kubernetes monitoring is already a complex, multi-step process — your monitoring solution should help this process, not hinder it.
Learn more about the free edition of Circonus’ Kubernetes monitoring platform and how it can help your organization more easily maximize the benefits of Kubernetes.