
White Paper
The Internet of Everything and the Rise of Telemetry Intelligence

Imagine this. It is moments before the season premiere of a greatly anticipated new TV series being launched by a major streaming media company. All indications are that this will be the biggest launch in the company’s history. The show’s executives and operational staff are crowded in the company’s war room anxiously counting down the minutes, all eyes are locked on glowing screens of performance graphs and dashboards hoping they’ve done enough to be prepared, that they’ve provisioned enough server and network capacity, and that the viewer experience will be flawless. All that time, all that investment, all now riding on the performance of technology. You can cut the tension with a knife.
If this was your business, would you be ready?
The performance of technology and the ability to monitor it has never been more critical. Technology has become a vital part of our world and we depend on that technology even more than we realize. But the landscape is changing rapidly as technology becomes more complex, the number of servers, devices, and sensors we need to track proliferates, and the amount of data they generate becomes overwhelming.
Without realizing it, the scope and complexity of your technology estate may well have expanded with little notice beyond your current monitoring capabilities. You may be only monitoring a fraction of the critical infrastructure that underpins the successful operations of your business. And you may be only one misstep away from a catastrophic outage or service degradation. Are you really seeing all the data you need to see and with enough clarity and timeliness to act decisively and proactively?
The odds are you’re not.

A Swiftly Tilting Planet
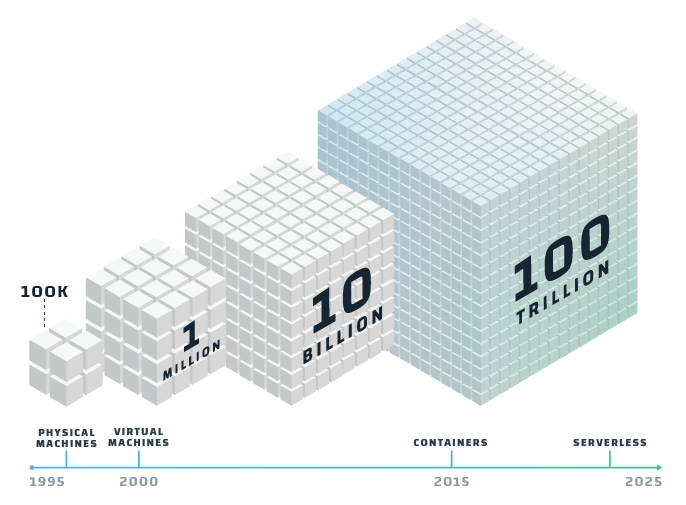
It is estimated that within the next 15 years, there will be a trillion connected computers and devices on the planet — outnumbering humans by over 100 to 1. That is a staggering figure. The world is moving online at an ever-accelerating pace across all industries: healthcare, media, manufacturing, transportation, retail, and finance to name a few. And we are plugging more and more of our physical world into our online universe as well – from thermostats, refrigerators, and toasters on one end to cars, buildings, pipelines, and power grids on the other.
Data has overtaken oil as the most valuable asset on the planet.
As the cost of computerization and connectivity continues to plummet, and therefore the number of computers, servers, devices, and sensors continues to proliferate, there is another major trend rapidly unfolding: they are generating an unfathomable amount of telemetry data. Telemetry data (the metrics, events, logs, and traces being generated by applications and IT infrastructure) is growing so rapidly, it is virtually impossible to quantify. Theo Schlossnagle, distinguished engineer and founder of Circonus, estimates that telemetry data is growing at the rate of 1×10¹² every ten years — it’s doubling roughly every 3 to 4 months…
At a time when data has overtaken oil as the most valuable asset on the planet, telemetry is an entirely new and virtually untapped source of extraordinary business insights. It is data so dense and rich with potential value, it will eclipse traditional business intelligence as a source of competitive advantage. The typical enterprise is practically drowning in telemetry and only tapping a small percentage of its potential value. Imagine if they could tap into all of it…

What’s Happening?
There are four major trends behind the explosion of telemetry data:
Digital Transformation
Digital transformation will continue unabated as enterprises seek to achieve ever greater productivity gains, innovate product offerings, and uncover new sources of competitive advantage. An IDC survey from 2018 suggested nearly half of all businesses were in the early stages of digital transformation and that only 7% had completed their journey. Accelerated by the global pandemic however, organizations around the world have been in a virtual stampede to move commerce and services online. Organizations have moved from needing a “web presence” in the 90’s to being a fully digital and integrated enterprise today.
Rapidly Evolving Technology
In the space of little more than a half century, we’ve gone from vacuum tube powered mainframes with less power than a smartphone to cloud computing data centers the size of small towns that power global digital commerce. In the last decade alone we’ve seen the adoption of virtual machines, containers, microservices architecture, and serverless technologies. Each generation of technology produces exponentially more telemetry than the generation before. A typical server generates something in the neighborhood of 150–200 metrics whereas a typical container will generate a thousand times that amount.
IoT Deployments
The Internet of Things (IoT) is the biggest of all big data domains. IDC estimates that the IoT will generate 79.4 Zettabytes (1021 or 1,000,000,000,000,000,000,000 bytes) of data by 2025. The promise of IoT is great but there are also challenges. Cisco estimates that 60 percent of IoT initiatives stall at the proof-of-concept stage and only 26 percent of companies have had an IoT initiative that they considered a complete success. One big reason is the ability to harness and makes sense of all that data.
5G Applications and Edge Processing
With faster speeds, lower latency, and higher operating frequencies, “ultra-wide band” 5G networks will unleash an enormous amount of network capacity over today’s 4G networks. This new capacity will power a whole new generation of innovative applications that will take advantage of 5G networks and edge processing capabilities using technology such as virtual reality. In addition to powering our smart phones and mobile apps, 5G will be essential in realizing the promise of tomorrow’s “smart” cities, grids, factories, cars and homes.
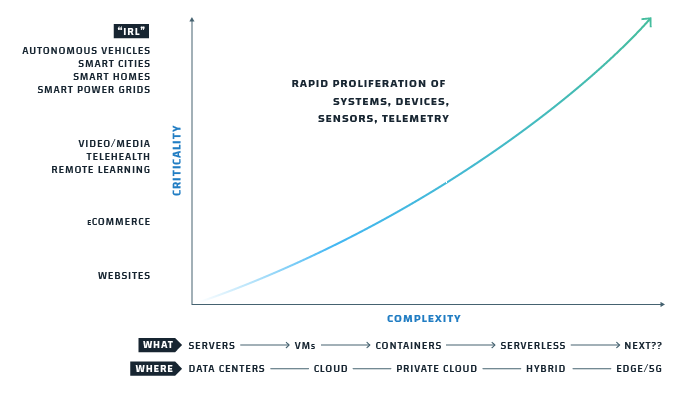
Performance Monitoring Landscape Changing Rapidly
As more of our world becomes computerized, digitized, and virtualized, this underlying technology infrastructure — whether it’s the servers that power cloud computing or the sensors attached to everyday ordinary objects — has become not just instrumental, but indispensable. And the criticality of the functions it supports has also increased dramatically. Technology has become an integral part of our daily lives: how we work, meet, learn, shop, entertain, commute, build, transact, and finance. It was one thing when that 90’s “web presence” website was down, it’s quite another when your supply chain is down.
Where workloads run and where data is being generated is also changing rapidly. More and more, IT infrastructure is becoming virtualized and the complexity of deploying and executing workloads abstracted. With containerization, developers build apps that are totally compute and location agnostic. Workloads run where they are best placed to perform optimally: in a data center, in the cloud, on the shop floor, or at the edge. Which means data and telemetry generation is also becoming increasingly distributed. Gartner reports that by 2022, 50% of enterprise-generated data will be created and processed outside of a traditional data center or cloud, up from less than 10% in 2019 and that number could reach 75% by 2025.
And with the evolution of IoT, edge computing, and 5G networks, the line between what is virtual and what is physical becomes harder to see. When hackers can use computer systems and networks to disrupt gas pipelines on the east coast of the United States (Colonial Pipeline Company incident) or disrupt nearly 1/5 of the world’s beef supply (JBS USA incident), or potentially shut down the entire U.S. power grid, is there any real difference?
The line between hardware and software is blurring. The line between IT and IoT is blurring. And the line between physical and virtual is blurring. Whether it’s infrastructure, apps, or networks, it’s all essentially software and it’s all generating enormous amounts of incredibly valuable telemetry data.

Implications for the Enterprise
The rapidly changing technology environment and explosion of telemetry data is placing tremendous strain on both IT systems and the people and teams that support them. At a time when most organizations are just trying to keep their collective heads above water, the pressure to move faster and the expectations of performance have never been greater. Outages can cost a fortune, and missing key trends and anomalies can be catastrophic. Businesses today have to answer to demanding customers, buyers, and investors, who are accustom to always-on availability, seamless experiences, and answers at their fingertips.
Customers expect perfect streaming experiences, perfect product experiences, personalization, and the availability of everything at the click of a mouse. When that doesn’t happen, it can quickly lead to dissatisfaction, creating the risk of lost revenue and customer churn.
Downtime, unplanned outages, and degradation of performance can be extremely costly. According to Gartner, the cost of infrastructure downtime averages $5,600 per minute, and can be as high as $540,000 per hour. A gaming company recently suffered a three-day outage losing an estimated $15mm in revenue and shedding $1.5 billion in market cap. For high-volume online retailers in the heart of the shopping season, lack of availability can quickly mount into the millions of dollars of lost revenue.
In businesses where technology essentially is the business, good enough is no longer good enough.
If you’re wondering if your current performance monitoring tools are keeping up with the times, you’re not alone. The sharp increase in online activity driven by the global pandemic exposed weaknesses in the monitoring programs of many businesses. Many enterprises even today have inadequate monitoring deployments and practices in place. Many are unsure if they are even monitoring the right things.
With the growing volume of telemetry data and the complexity of distributed systems, these challenges are only going to grow.
The Art of the Possible
To date, telemetry has been used to monitor and inform. It’s been a defensive and reactive posture focused on responding to problems and outages even as many companies still feel they are “flying blind” (the vast majority of companies continue to suffer unexpected outages). Monitoring has been seen as a necessary expense but certainly not as a driver of business value and innovation.
But what if you could see all of your telemetry without limits? What if real-time streaming really meant real-time, upon ingestion, not seconds or minutes later? What if you could handle any volume, so you didn’t have to use averages, or averages of averages, when answering queries? What if you could analyze data at frequencies in the milliseconds, versus seconds or minutes? What if you could do this 24x7x365? What if you could cost-effectively store your data to further analyze for historical trends, customer usage patterns, and operational performance? What if you could derive value from every data point? It’s not only possible, it’s happening now.
The key to mining the full value and potential of telemetry is the ability to capture all your data, at the speed and frequency it is being generated, and be able to retain that resolution of data without limit. And the more data the better. The greater the density and richness of the data, the greater the accuracy, precision, confidence, predictive qualities, and insights. It’s not too unlike the resolution of a digital photograph — without high resolution, when you zoom in to see more detail (e.g., make a query or conduct an analysis), you see a blurry, pixelated image instead.
The greater the density and richness of the data, the greater the accuracy, precision, confidence, predictive qualities, and insights.
Tapping into the full value of your telemetry data can be transformational, delivering real and measurable results. Whether you are responsible for the happiness of millions of customers or the performance of an energy grid, or something in between, the ability to have accurate, real-time data on demand is imperative. Better data leads to better decision making, faster incident response and resolution, and smarter investments in future services. The key to unlocking this enormous potential is the ability to harness and make sense of the tsunami of telemetry data already being generated in your enterprise.

Telemetry Intelligence – Next Generation Monitoring
Telemetry intelligence is the ability to gather, correlate, and analyze vast amounts of data streaming from computers, sensors, systems, and connected devices etc., to achieve new levels of insight that drive smarter operations, better decision-making, and new business opportunities.
In the early days of the Internet, first generation performance monitoring solutions were fairly basic. Ping is the best-known product from this time and as its name suggests, it would ping a website on a regular basis to make sure it was responding. Metrics were limited (round trip time, packet loss etc.) and advanced analytics were non-existent.
Current generation monitoring and observability tools provide far greater capabilities but still rely heavily on the user to know and define acceptable performance parameters and to manually set up alerts and notifications. Many current monitoring tools were built for a cloud-centric world ignoring the realities of the hybrid, distributed enterprise. In a distributed world, monitoring tools that attempt to ship all telemetry data to the cloud for analysis are fundamentally broken. Current monitoring tools also require limits in order to function. Limits on volume, limits on frequency, limits on storage, limits on scale. They limit the very thing that drives value.
Next-generation monitoring and observability platforms leverage the power of telemetry intelligence to drive next-level performance. They are able to collect and ingest incredibly high volume and high frequency data (think trillions of measurements per second across billions of metrics tracked). They use AI and ML to find signal in the noise, focusing operations on what’s truly important, accelerating root cause analysis and even taking unsupervised remediation actions. They can retain, find, and quickly retrieve telemetry data and execute sophisticated and complex real-time, historical, and predictive analytics against that data. They are able to perform real time analytics and anomaly detection where the telemetry is generated — edge to edge. And they are technology, source, and location agnostic.
The ability to tap into this ocean of data, monitor and analyze it in real time, and collect and store it in such a way that it can be mined at will, without compromise or constraints, is at the heart of next-generation telemetry intelligence.

Real World Examples
Telemetry intelligence is already being deployed across a variety of industries and addressing a wide range of business challenges and objectives.
In the entertainment industry, a well-known cable network is using telemetry intelligence to monitor the latency and overall performance of its streaming media to ensure a flawless end-user experience. Because the data is able to be retained indefinitely, they are also able to compare performance season over season. In the streaming media business, poor user experience can lead to subscription churn and loss of revenue.
In the Adtech industry, exchanges facilitate rapid-fire transactions — often occurring within hundreds of milliseconds — that involve the bidding, buying and selling of advertising space on websites. One industry leader is collecting a quarter billion metrics every minute and with that level of data density, they are able to detect fraud on their platform. With the massive volume of data generated from each transaction over online ad exchanges, any anomaly overlooked could undermine the integrity of the ad exchange, causing a loss of confidence and trust for both buyers and sellers, and ultimately a loss of revenue.
A major services company in the oil and gas industry is using telemetry intelligence to ingest high-frequency measurements off its wellheads, and using that rich data to optimize its fracking operations. Optimization leads to better effectiveness and efficiency of fracking techniques, improving both the bottom and top lines of the business. Safety is also a major concern with high-pressure fracking techniques as too much pressure in one wellhead could lead to the explosion of another.
Utility companies are able to model, predict, and make adjustments for seasonal energy consumption; insurance companies are able to use biometric data to create entirely new products like “usage-based” insurance; manufacturers are able to use telemetry from sensors and controllers to perform predictive maintenance and avoid costly downtime; and property management companies can tell when a new appliance has been added to an apartment and even what the make and model of that appliance might be.
What’s Next for Telemetry Intelligence?
We have just begun to scratch the surface of what telemetry can tell us. The possibilities of telemetry intelligence, across all sectors and industries, are limited only by our creativity and imagination.
Collectively, the real-time telemetry being generated by nearly every modern business in the world is actually giving rise to a phenomenon called “instant economics.” One such example from the pandemic involved uploading temperature readings from a million digital thermometers in order to predict increases in virus infections. As recently described byThe Economist: “The results are still rudimentary, but as digital devices, sensors and fast payments become ubiquitous, the ability to observe the economy accurately and speedily will improve. The world is on the brink of a real-time revolution in economics, as the quality and timeliness of information are transformed.”
Imagine applying that same intelligence to the economics of a business. Telemetry intelligence will totally reshape the business landscape in the next decade. It will unleash new business models, create new sources of competitive advantage, give birth to innovative new products and services, disrupt existing markets and players, and give rise to an entirely new set of market leaders.
The companies that are able to harness and analyze telemetry data at scale and use that intelligence to optimize operations, innovate new products and services, and create entirely new revenue streams, will be the clear winners in this new “Internet of Everything” economy.