Modernize your backend capabilities with Circonus IRONdb – our highly scalable time series database that is a drop-in replacement for Whisper – or leverage the full Circonus monitoring and analytics platform for even more power and flexibility.
Easily import in less than 24 hours
Circonus’ time series database is a drop-in replacement for Graphite’s Whisper database and supports ingestion from Carbon sources like carbon-relay and carbon-c-relay. There’s no need to change your queries, learn a new language, or change your dashboards. In fact, there’s no need to change a thing—just keep doing what you do and prepare to be shocked by the noticeable improvement in how quickly things get done.
Circonus supports Graphite-web through a hosted Graphite-web instance, and existing dashboards will seamlessly continue to work by simply changing the underlying Graphite datasource endpoint to Circonus. You can also import legacy data in near zero time – the moment data is received, it’s indexed and immediately available.
Boost flexibility and improve productivity
Many organizations relying on Graphite leverage telemetry provided through StatsD, which means your ingestion pipeline is likely stuck collecting millions of metrics you don’t need while lacking the ones you do need (a result of static pre-aggregations).
With Circonus, you can eliminate pre-aggregation servers and significantly simplify your metric ingestion pipeline with OpenHistogram, which enables you to conduct on-demand aggregations whenever you choose, after ingestion. In the end, your metric ingestion will be reduced by 20-40x, overhead is substantially reduced, and you have more flexibility in monitoring SLOs.

How SREs Can Achieve More Success by Implementing Modern Monitoring
Remove visibility gaps with unified platform
Graphite users often are using multiple tools for managing logging, dashboards, and time series data, which is time intensive and results in data silos and manual correlation.
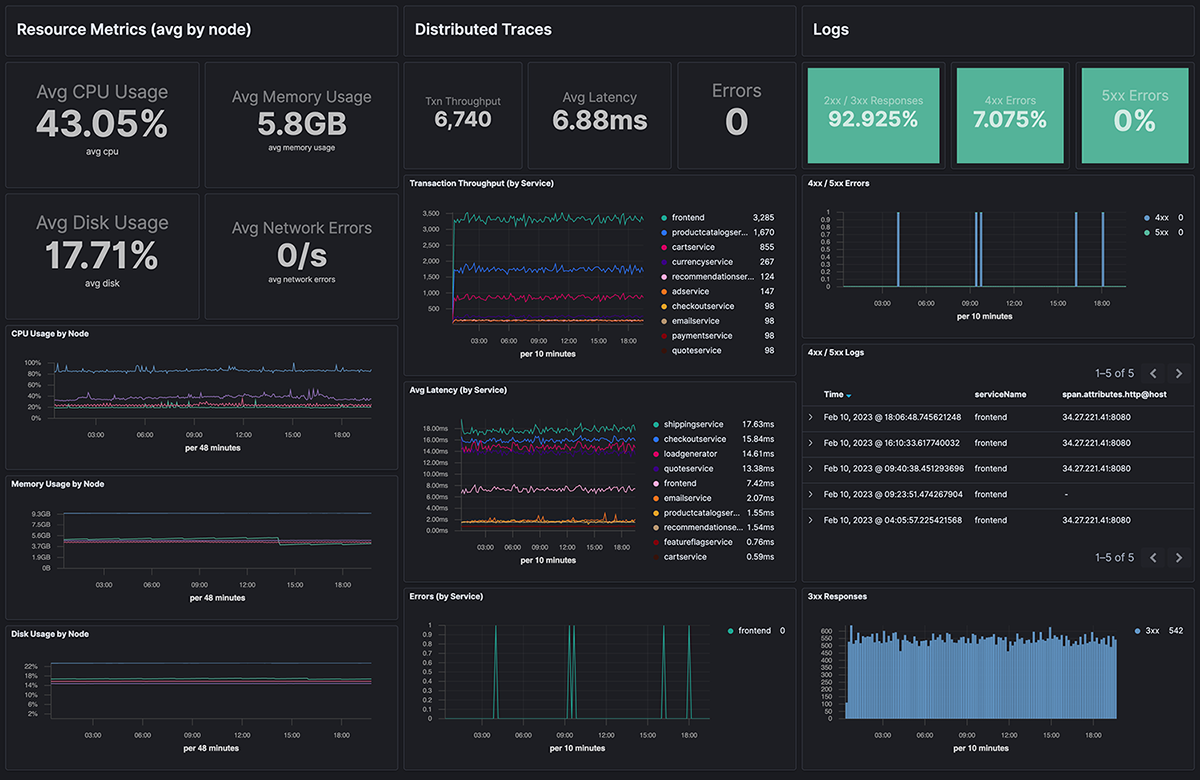
Circonus can consolidate your monitoring by replacing various tools. Our platform ingests logs, traces, and metrics from your entire environment, and our unified dashboards provides all of this data within a single pane of glass. In one view, you immediately gain context around problems by correlating metrics and traces with the relevant logs, so you can quickly identify root cause and resolve issues before users notice them.
Achieve more scale using less resources
As modern enterprises have seen an explosive growth of telemetry volume, Graphite’s Whisper database, which once worked so well, now severely underperforms when trying to meet the challenges of scale. Also, the data you’re storing with Graphite isn’t truly safe because Graphite has poor to no data redundancy, creating a single point of failure.
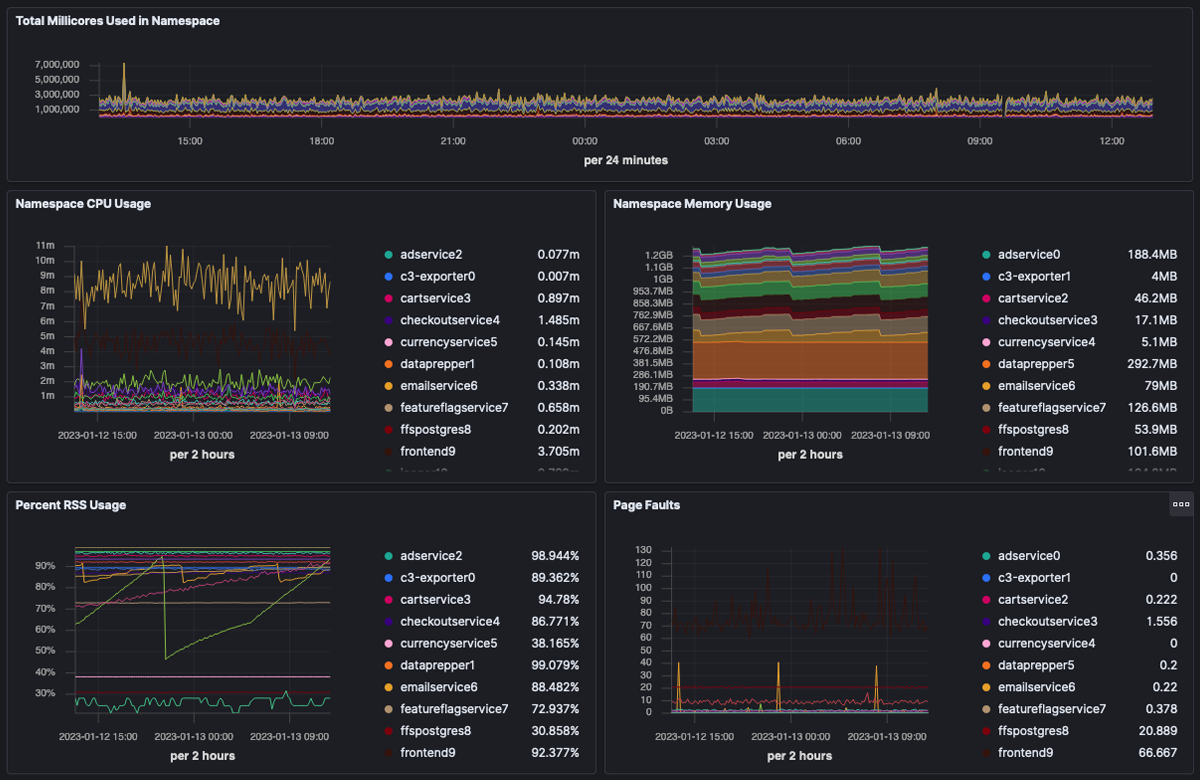
The Circonus platform can ingest telemetry at unlimited scale (trillions of measurements per second) without any impact to performance, and stores data infinitely to enable powerful historical analysis. Circonus operates with data replicated across multiple availability zones and stores multiple copies of data in a cluster of nodes, which overlap data collection so that it’s never in one place.
We evaluated multiple monitoring platforms and ultimately selected Circonus because of its ability to collect, store, and analyze massive amounts of telemetry data at such high frequency and granularity. This is exactly what we needed to ensure our data analysis is accurate. We also liked that Circonus integrates with our Grafana implementation for visualizations, and that it provides comprehensive visibility across both our private datacenter and also our infrastructure in AWS.
Richa Sehgal, Senior Software Engineer
Redfin