
While Prometheus has been available since 2012, its popularity has skyrocketed in the last five years as it became the de facto solution for Kubernetes. Although Prometheus may be suitable for smaller environments, it was not designed for ultra high scale use cases or for storing data long-term. So as organizations are increasingly growing their Kubernetes deployments and generating substantially more data, they are reaching the limits of what they can do with standard Prometheus implementations.
As companies generate more data, Prometheus can require dedicated staff to maintain it, and they often address scaling issues by following a federated approach or by reaching for additional tools like Thanos.
In the following post, I share some limitations we frequently see organizations experiencing with Prometheus. If you’re living these as well (or maybe soon will be), perhaps you’ve outgrown Prometheus and it’s time to consider an alternative.
At Circonus, we have a Prometheus compatible time series solution that largely eliminates challenges related to scale. And the great news is that everything you’ve built around your Prometheus deployment – your Grafana dashboards, alerts, widgets, processes, tooling – can all move over to Circonus without extra work.
Prometheus Limitations
The following are Prometheus limitations that companies frequently face as they scale.
Managing Prometheus is costly and resource-intensive
The typical Prometheus deployment requires that each of your Kubernetes clusters has its own Prometheus instance. This isn’t so bad if you have just a few K8s clusters, but there are many reasons why the number of Kubernetes clusters can start to multiply. Sometimes it’s a function of use case, where Kubernetes runs at a physical location like a stadium or storefront, and sometimes it aligns with teams within an organization, where each application team has their own cluster.
Whatever the reason, the multicluster model quickly becomes a nightmare as you scale. Organizations find themselves managing one or two Prometheus instances one year to dozens the next, which becomes costly and requires teams solely dedicated to overseeing it. This also creates challenges to having a global view of your environment and although there are workarounds to enable this, it’s resource-intensive.
Because Prometheus instances are typically aligned to a single Kubernete cluster or a single application, the blast radius of a single Prometheus instance failing is relatively small. You might lose visibility to a single application or a single cluster, but your entire observability strategy won’t necessarily be impacted. However, this creates its own set of problems because anytime you have multiple instances of the same environment, version drift or configuration problems can occur. Again, managing this with 5 clusters isn’t an issue. But you start having 20, 60, 80, and it becomes a real challenge, even when following best practices around GitOps.
Federating Prometheus instances is a partial and expensive solution
Many organizations take a federated approach to managing Kubernetes with Prometheus, which means having multiple Kubernetes clusters scoped to specific use cases or clusters. This works if there is never a need for the data to cross application boundaries in real time. While there are ways to solve some of these problems, there’s no easy way to make this maintainable long term.
Prometheus lacks horizontal scalability, accuracy, and long-term storage
Prometheus is a single host that cannot scale as metric count increases. You can throw more memory and CPU at it, but you can’t really balance this across multiple instances. Again, there are vendors that have entered this space to enable sharding, but it is far from the happy path for a Prometheus deployment. It also doesn’t perform great for queries with a lot of data since it only operates on raw data. It has “shortcut” functions like irate and idelta which sample the data, but their queries are performant at the cost of accuracy.
Because Prometheus was never intended to be a long-term storage platform, it is a poor fit for trending or historical data analysis. Users can really only leverage it for short-term performance and health monitoring, which is a huge limitation for organizations looking to implement more proactive monitoring.
Circonus: A Scalable Alternative with Minimal Migration Effort
Circonus is a modern full-stack observability platform that can function in many cases as a drop-in replacement for Prometheus. Here’s how we make it easy to flip the switch and address the limitation of Prometheus.
Keep your hard work and use familiar tools
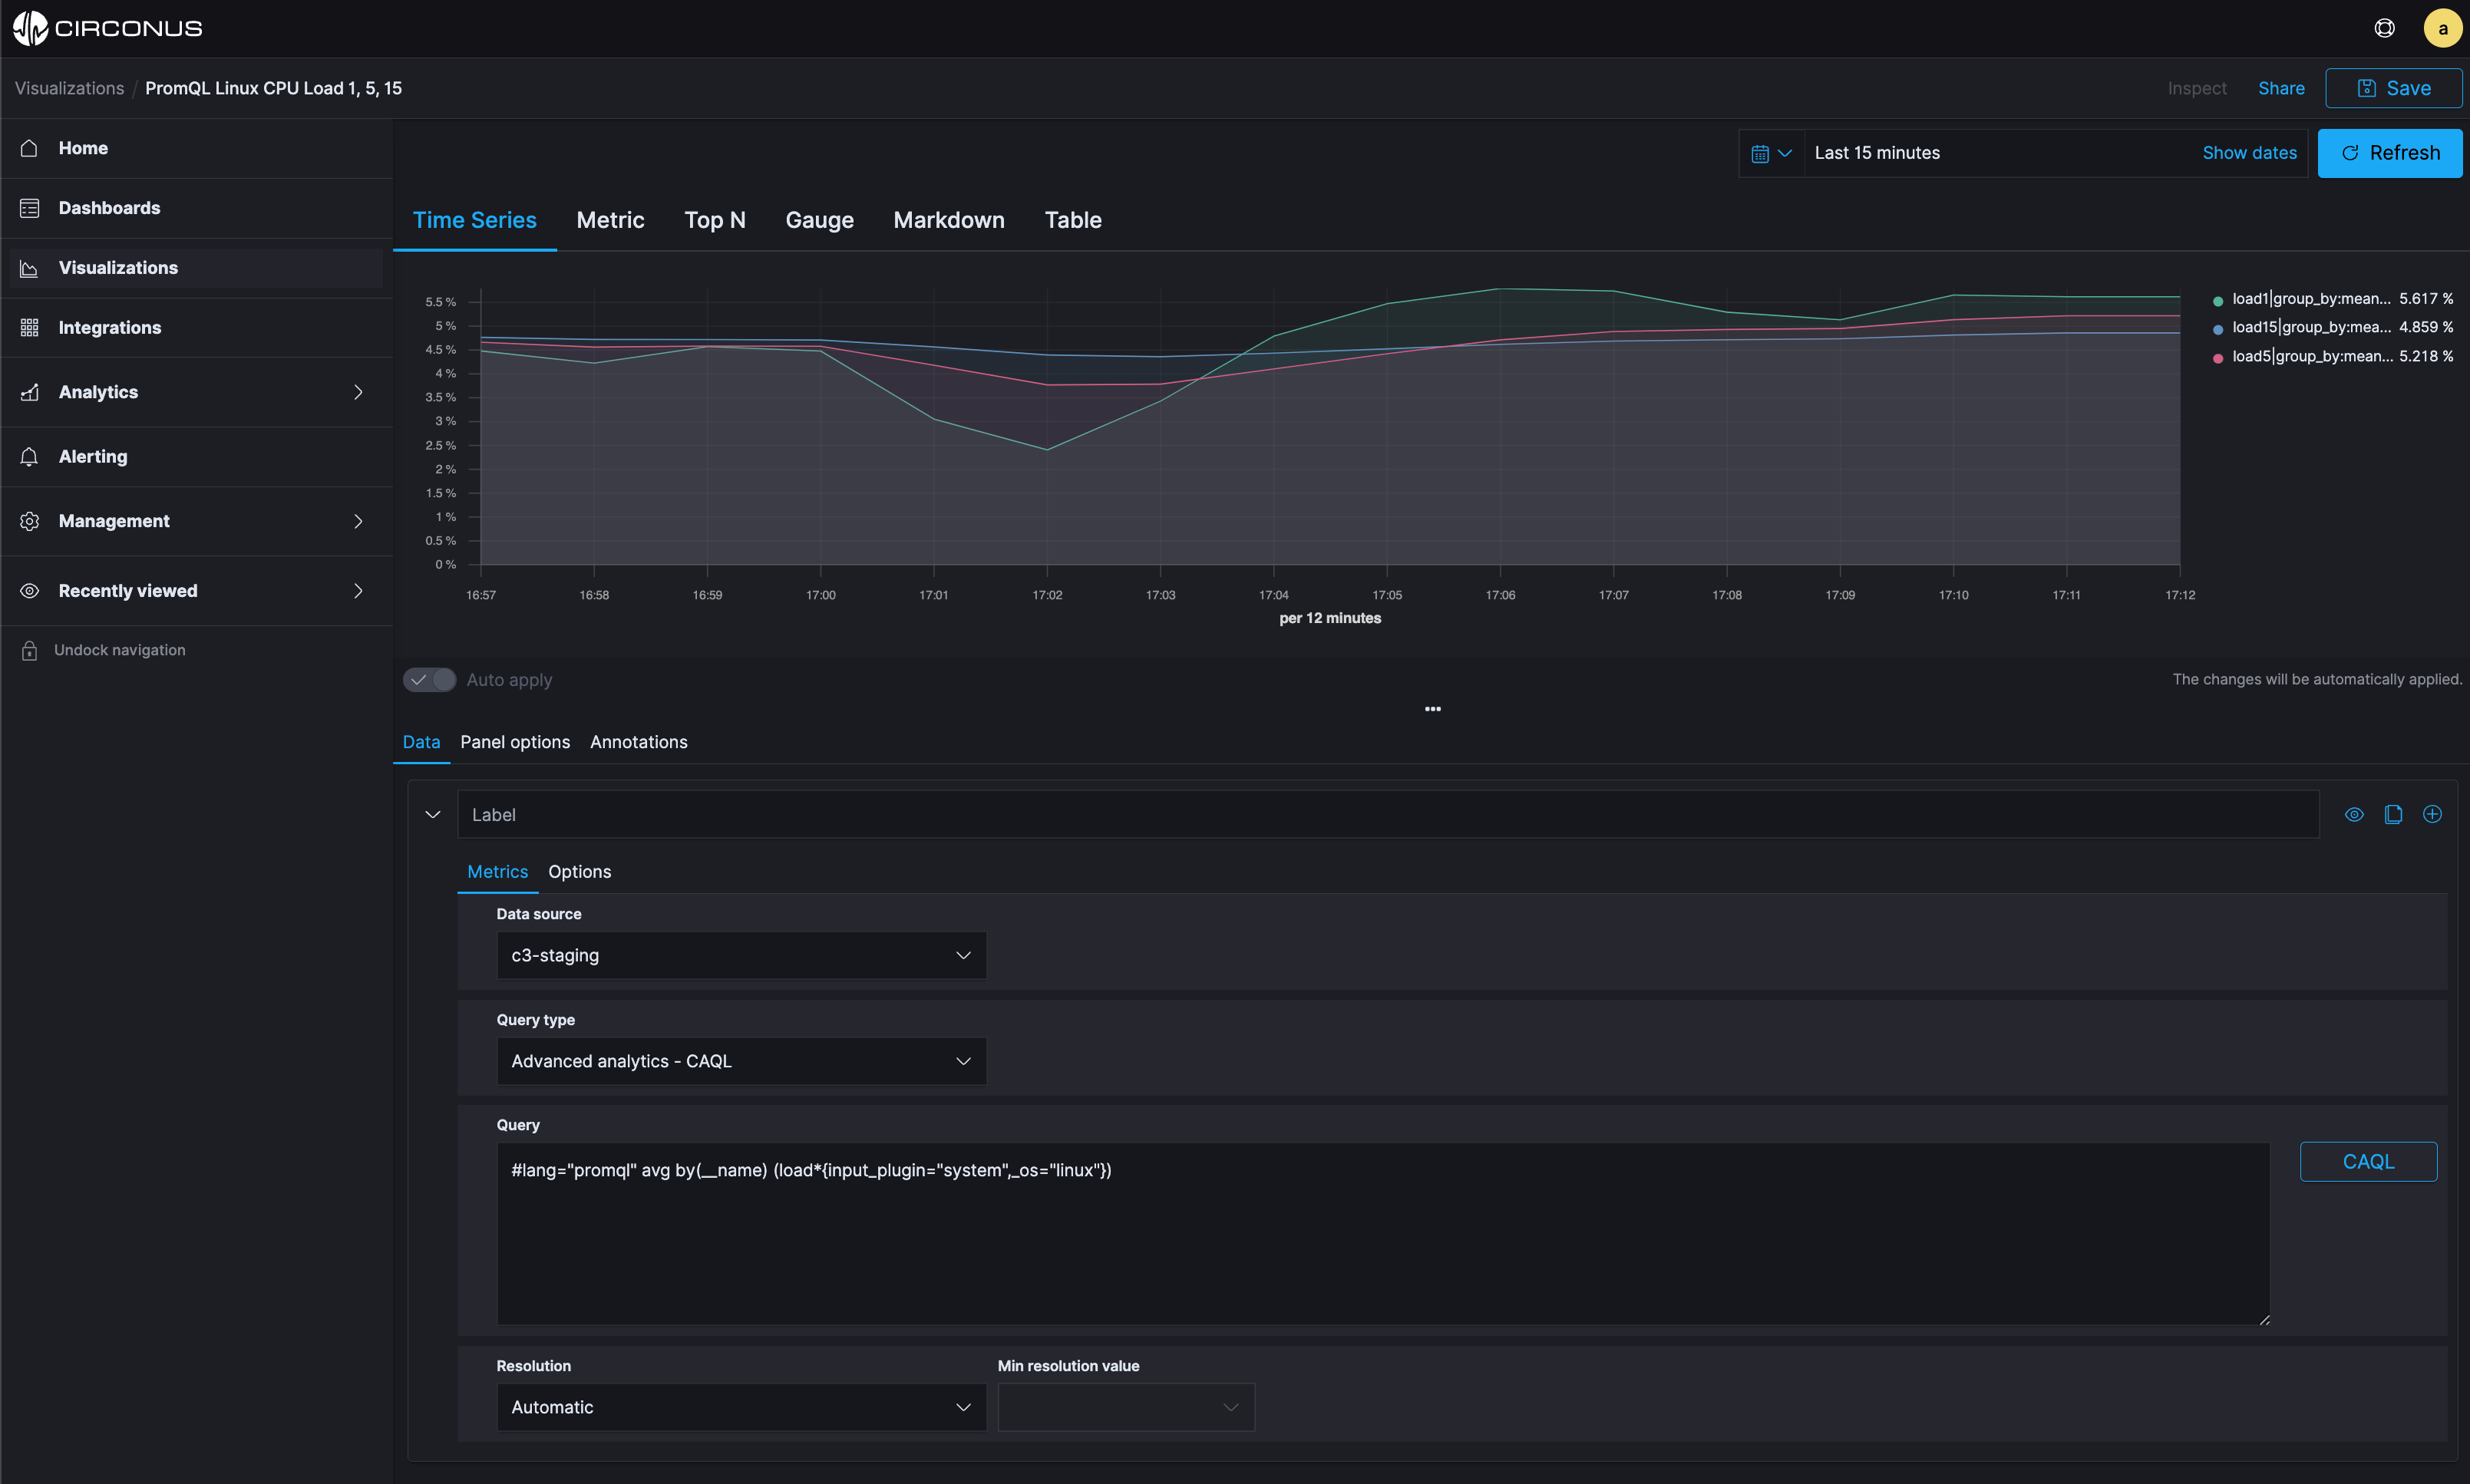
The majority of Prometheus users have built their dashboards in Grafana. If you switch to Circonus, you don’t have to worry about losing all the work you’ve done there. The standard Grafana datasource plugin for Prometheus works with Circonus, so simply point your dashboards to the Circonus datasource. Circonus supports PromQL, so your dashboards and queries continue to work as is with no additional effort.
Simple. Fast. Easy.
Remove visibility gaps
Unlike Prometheus, which requires managing multiple instances and different monitoring tools, Circonus ingests and analyzes logs, metrics, and traces from across your infrastructure, applications, and containers in one platform. As a result, users have the unified, global visibility they need to correlate data, identify emerging issues, and resolve problems faster.
The following Circonus unified dashboard animation shows how you can highlight a specific time period to correlate log errors with related throughput metrics and application latency all in one view.
Ensure data scale & accuracy
The Circonus Platform ingests telemetry at unlimited scale (trillions of measurements per second). As opposed to Prometheus, we do roll-ups of this data and correct math on them to ensure no sacrifice to data accuracy. Our platform also provides infinite retention of this data, enabling users to perform powerful historical data analysis essential for optimizing performance and preventing future issues.
Circonus can also prevent visibility issues caused by gaps in data. In the event of a network issue, Circonus brokers, a part of Circonus’ ingestion pipeline, can “store and forward” data to ensure it’s not lost. This was one of the key benefits our customer Major League Baseball realized when it switched from Prometheus to Circonus.
Final Thoughts
Prometheus is a great solution for a lot of companies and will continue to be if they’re operating a small environment. But for those organizations outgrowing Prometheus. Circonus provides a solution that removes the pain of migration. The result: operate at scale and without compromise, gain global visibility, and consolidate your monitoring in a platform that will empower you to achieve the modern observability you require.
Book a call with our solutions engineer to learn more.
Or if you prefer to experience Circonus for yourself first, check out our live sandbox and/or sign up for our free 14 day trial.


