Log Monitoring & Analytics

Quickly visualize, analyze, and correlate your log data at any scale — whether from your cloud, infrastructure, or applications.

Free Trial Circonus Sandbox

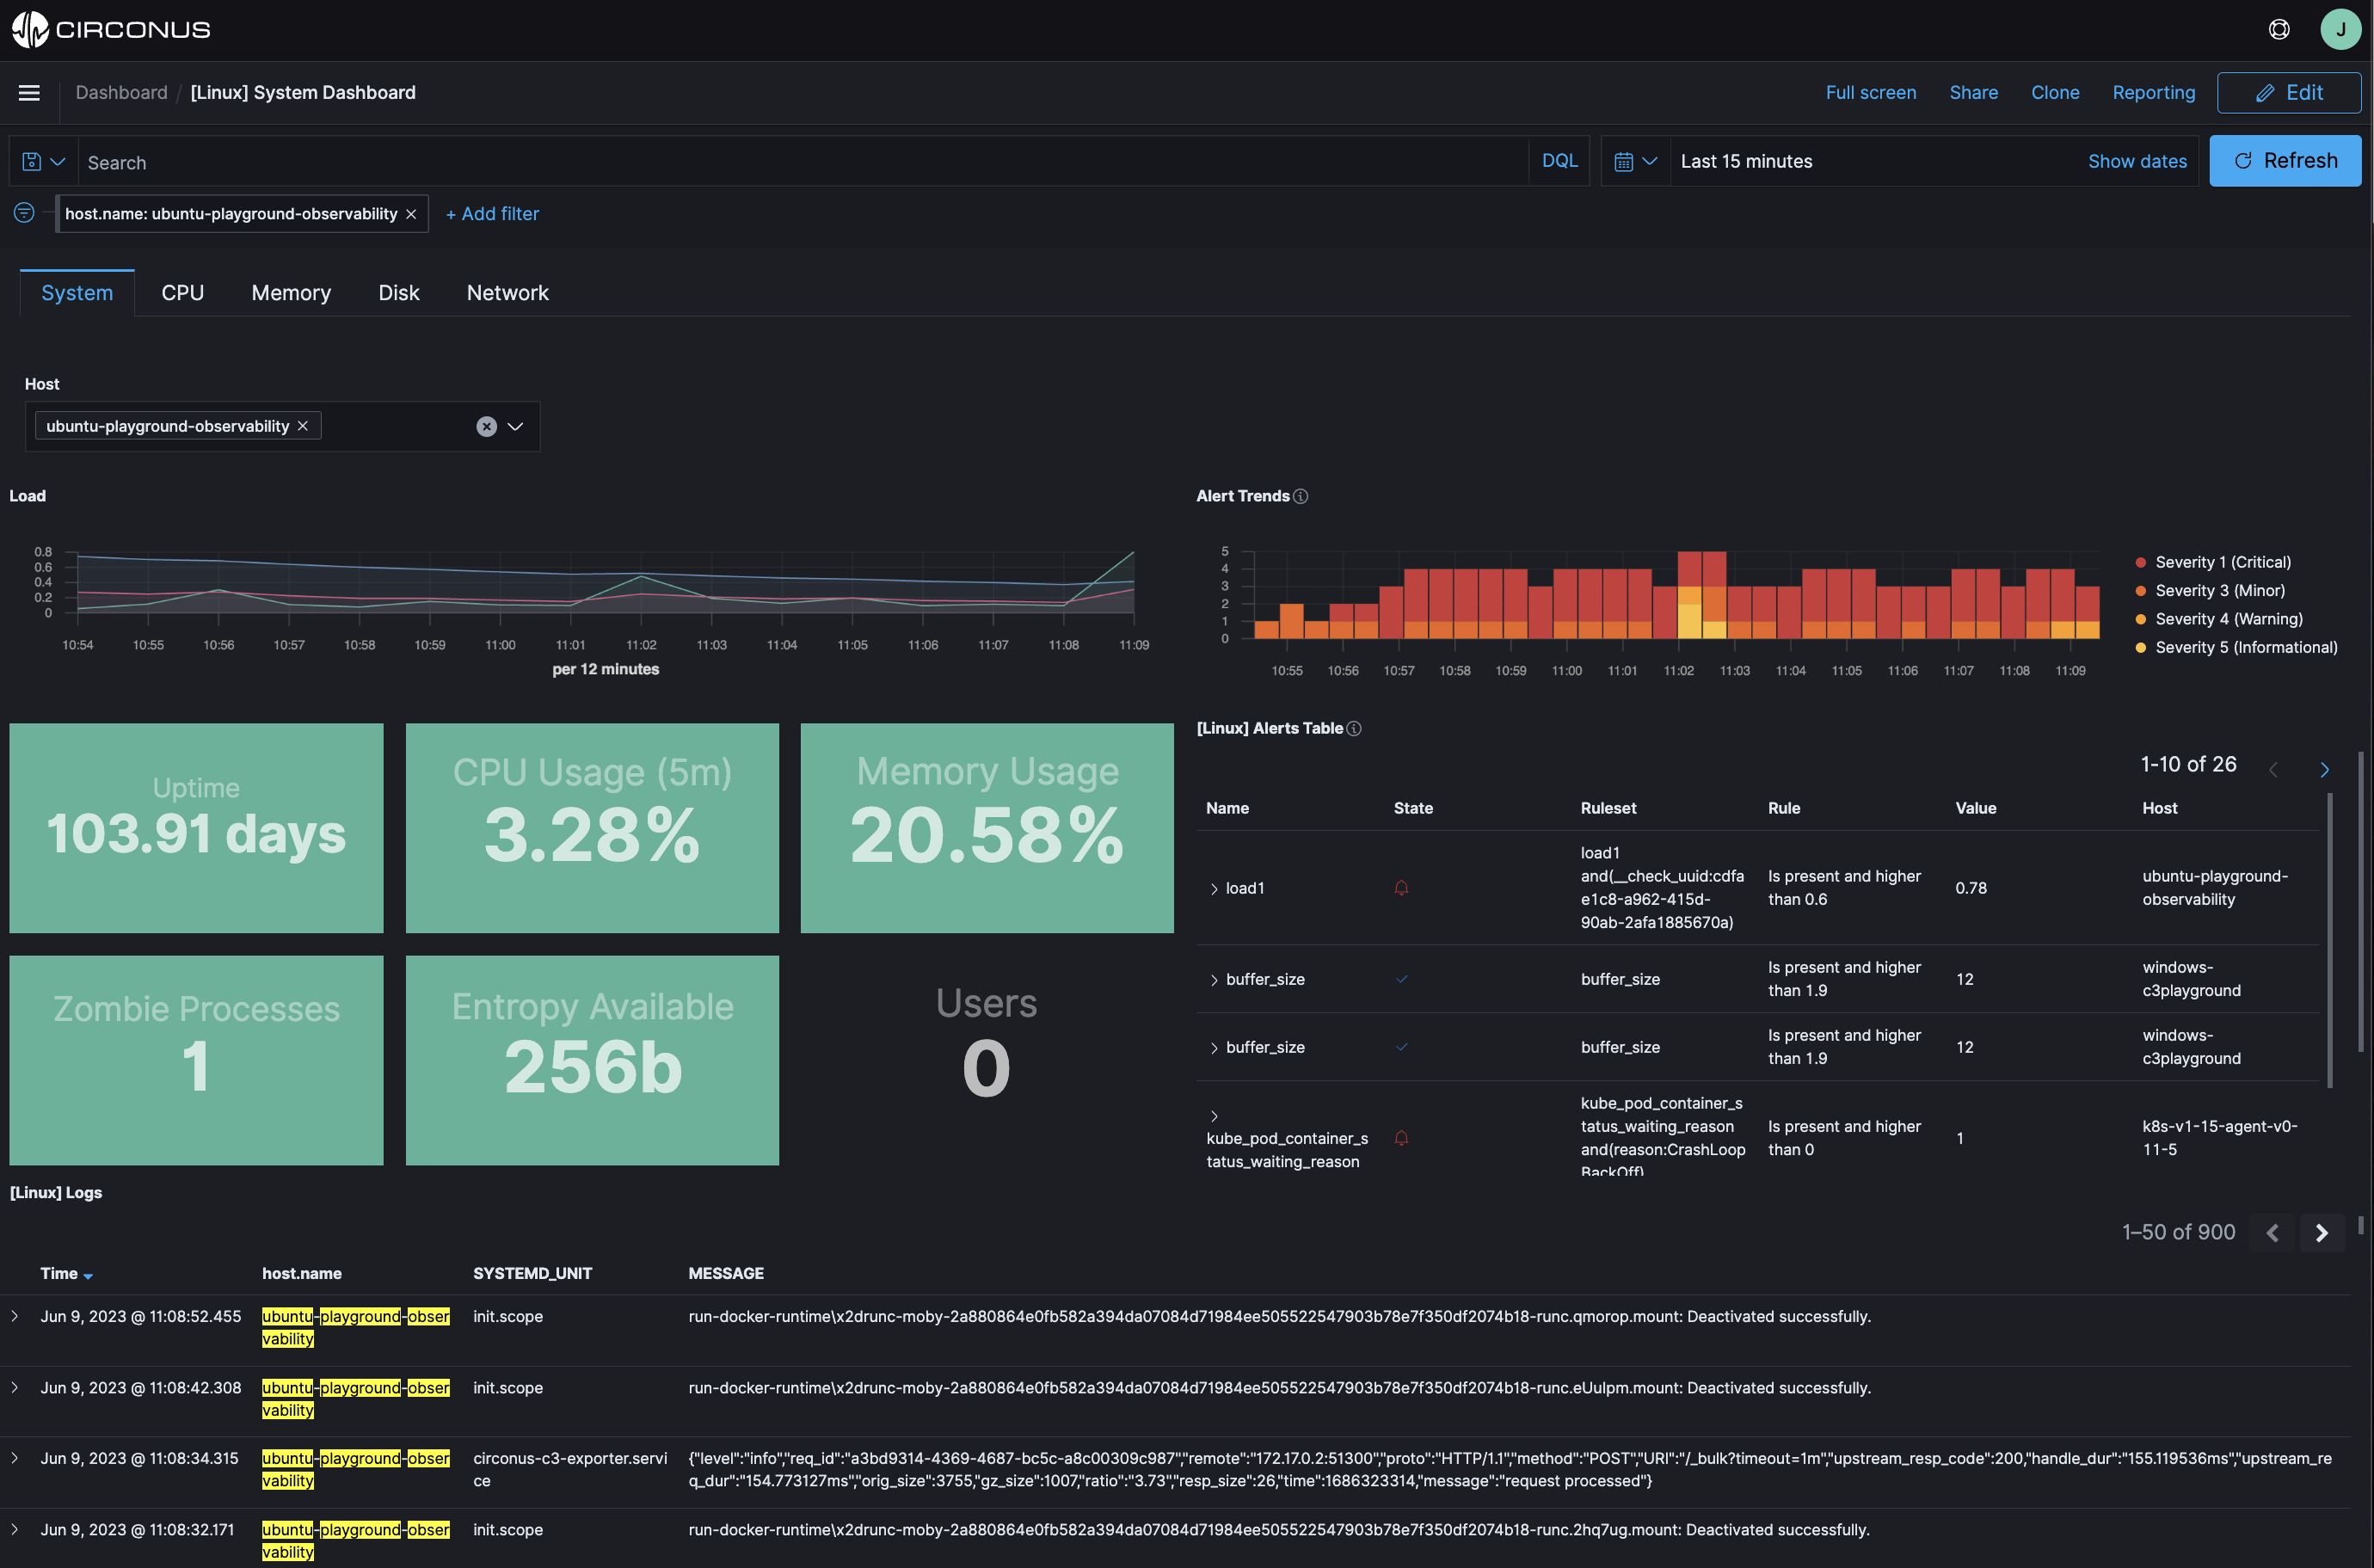
Maximize the value of your logs. Leverage unified dashboards to correlate logs with metrics and traces, and convert logs to metrics for more cost-effective storage that enables powerful trend and behavioral analysis.

Unified dashboard speeds MTTR

  • Analyze metrics, traces, and logs across in one unified dashboard to improve collaboration.
  • Correlate metrics and traces with logs in a single click to quickly identify root cause.
  • Manage all alerts through the same UI to see potential emerging issues.
Circonus Unified Dashboard

Increase efficiency with log search & visualizations

  • Transform unstructured log data into structured data to improve and speed queries and searches.
  • Visualize errors, latencies, outliers, and other log patterns and save directly to dashboards.
  • Visualize alert trends to see active alerts across your metric, logs, or traces and filter by severity to reduce alert fatigue.
Circonus Logs Explorer

— White Paper —

How SREs Can Achieve More Success by Implementing Modern Monitoring

Read now

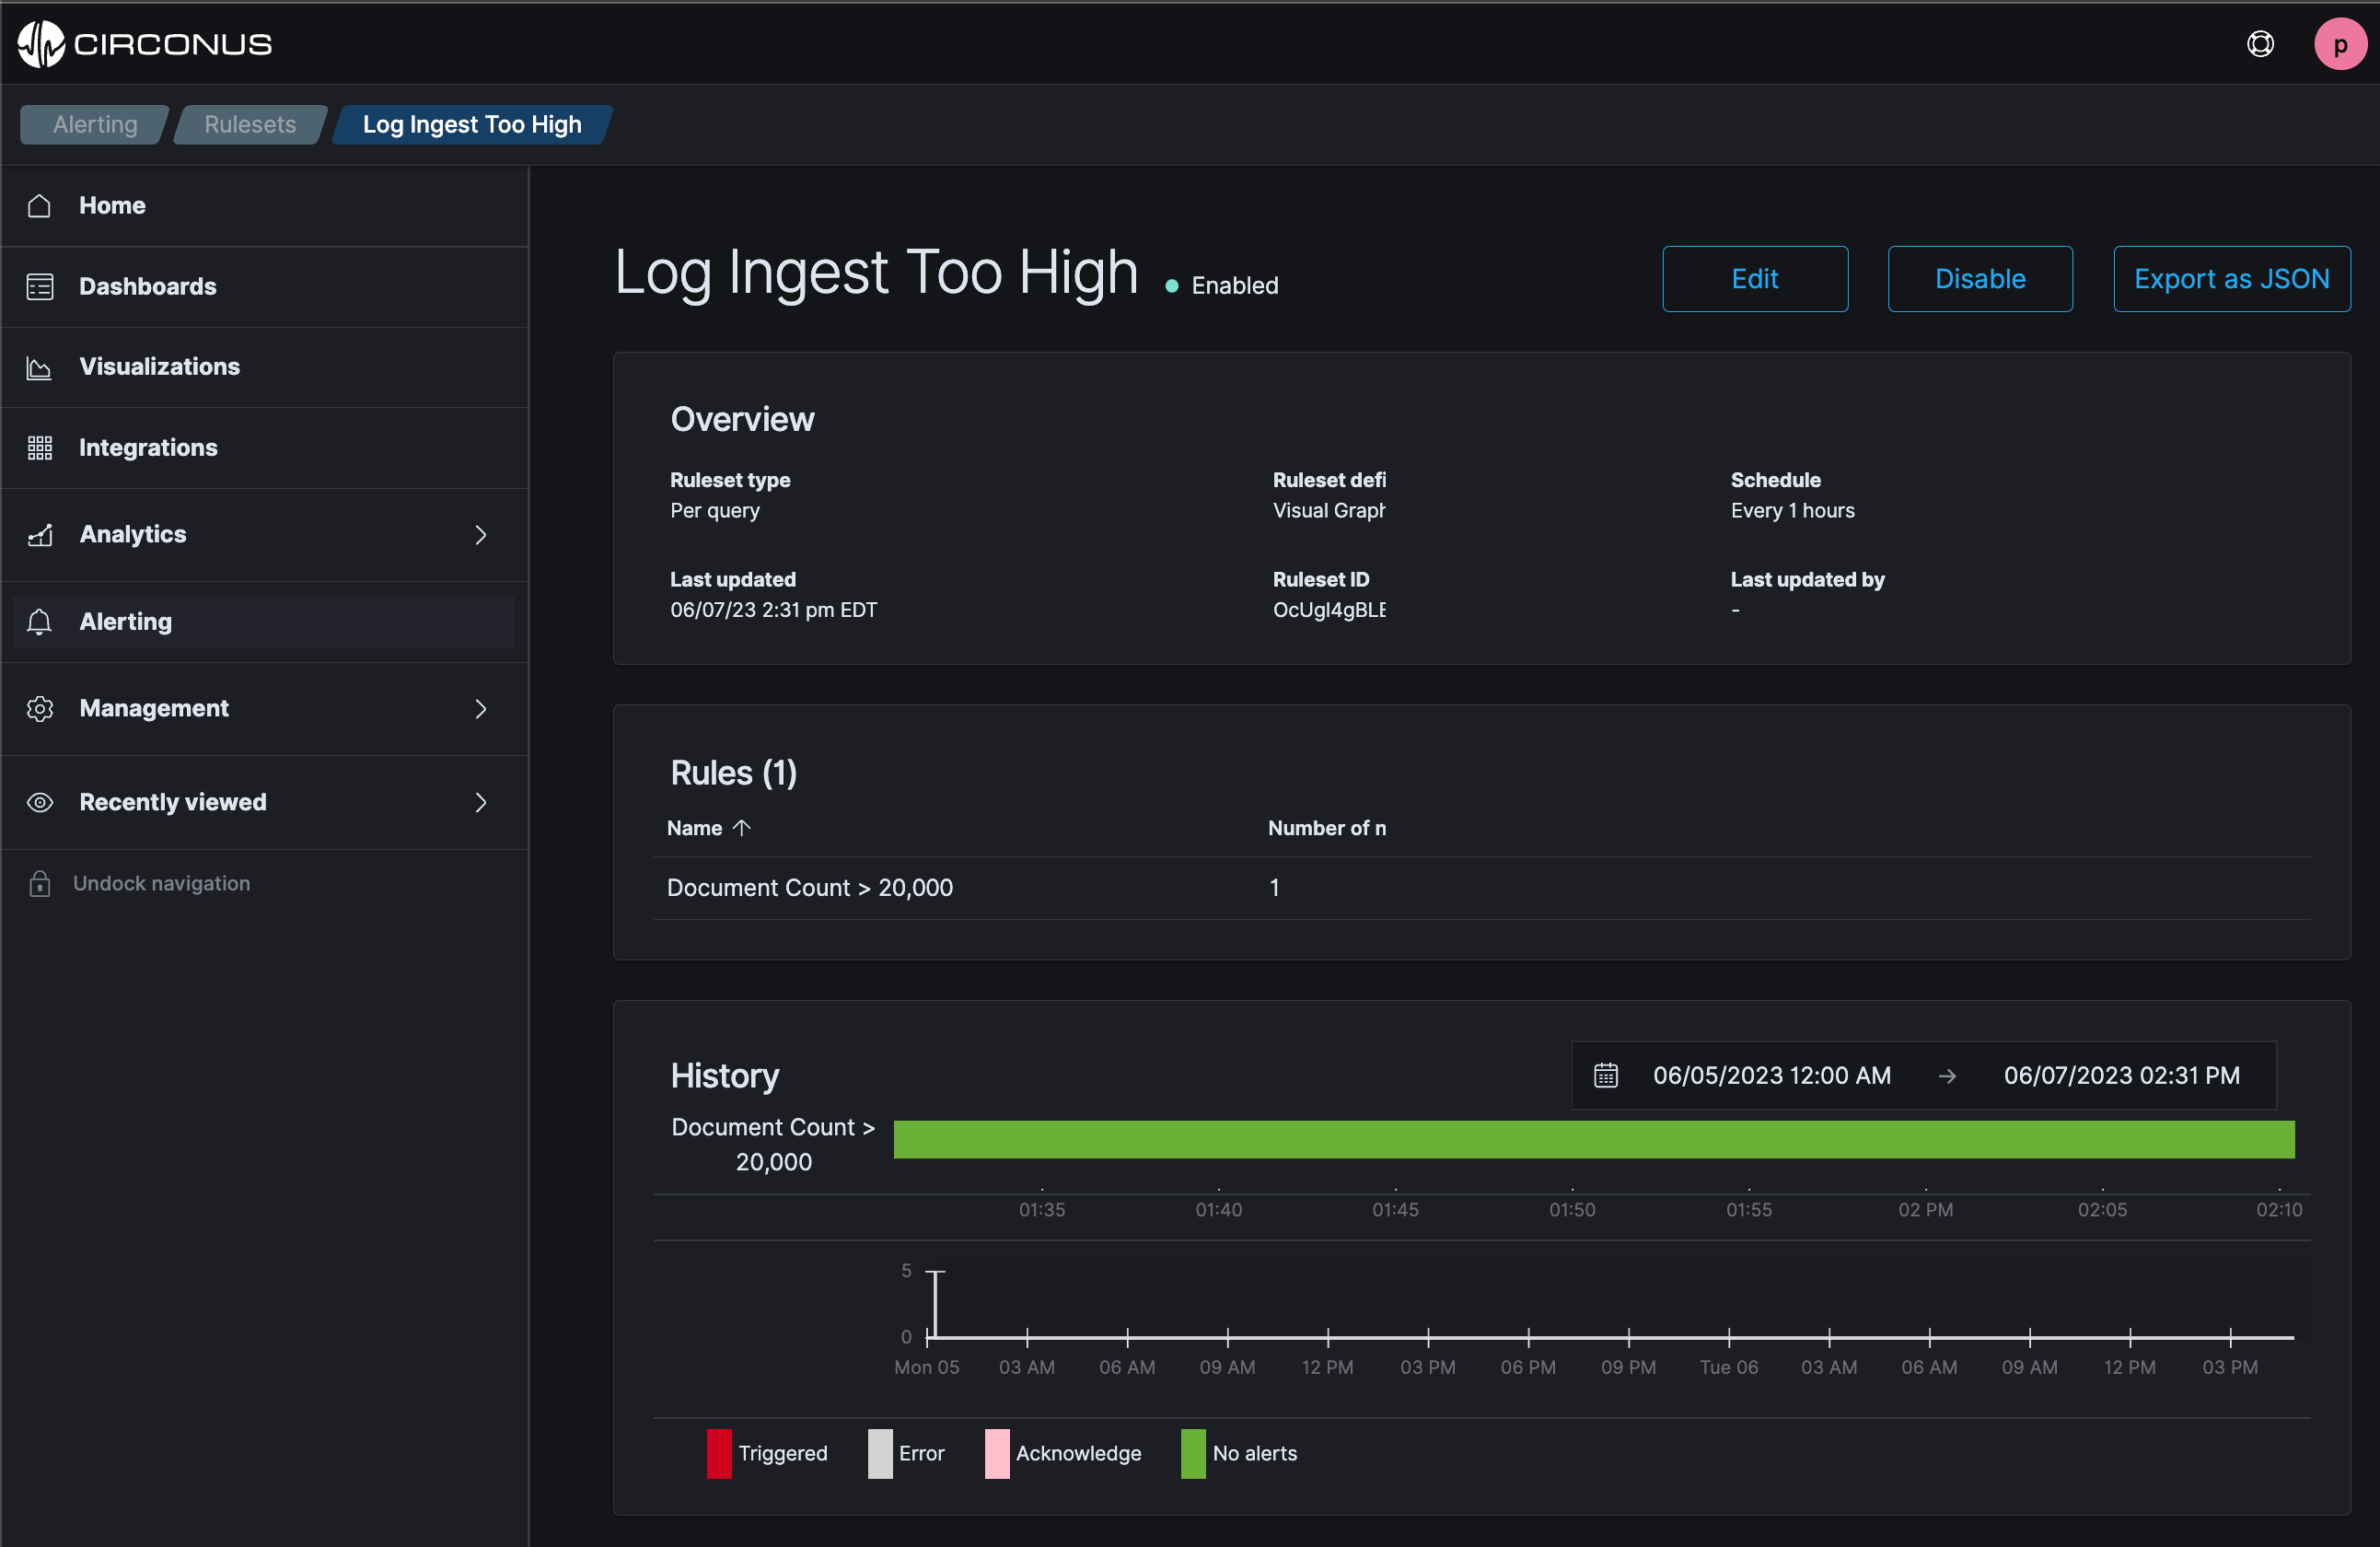
Improve response to issues with sophisticated alerting

  • Receive alerts against metrics that are triggered in real-time with streaming alerting.
  • Identify potential issues through analytic alerts, which identify patterns across logs.
  • Build customizable alerts based on log queries to limit noise or surface events.
  • Easily manage alerts and notifications with multiple alerting integrations.
Circonus Alerting Visualization

Achieve more scale and better insights at less cost

  • Convert logs to metrics for cost-effective long-term storage that enables trend and behavioral analysis.
  • Easily use the open source log collection agents you already have with support for FluentBit, Data Prepper, and OpenTelemetry.
  • Ingest, analyze, and store traces from any stack with unlimited scale and retention.
Circonus Otel Dashboard

“With Circonus we have been able to merge application performance modeling with SLOs, Kubernetes monitoring, and traditional network and hardware monitoring at high (and growing!) scale.”

“The richness of this high frequency data allows us to understand user and systems behavior with a level of detail we haven’t experienced as an organization before now. The ability to perform real-time analysis on billions of data points drives how we think about, and debug, performance for millions of baseball fans. Combined with a monitoring-as-code approach, our engineers get all of this delicious data out of the box with little to no time spent.”

Riley Berton, Principal SREMajor League Baseball

Monitoring and Observability Resources

How Major League Baseball Scales Kubernetes Monitoring

Blog: How Major League Baseball Scales Kubernetes Monitoring

5 Key Requirements of Modern Monitoring and Observability Platforms

Blog: 5 Key Requirements of Modern Monitoring and Observability Platforms

How to Correctly Frame and Calculate Latency SLOs

E-Book: How to Correctly Frame and Calculate Latency SLOs

Trusted by industry leaders worldwide

Smugmug Logo
MLB Logo
Xandr Logo
HBO Logo
Redfin Logo

Hundreds of Integrations

GCP
Graphite
Kubernetes
CollectD
Docker
Cisco

See where Circonus can take you.

Learn how monitoring without limits can drive new levels of value and impact in your business and operations.

Free Trial Circonus Sandbox