IT Infrastructure Monitoring

Gain complete visibility into the health and performance of your entire infrastructure.

Free Trial Circonus Sandbox

Circonus’ infrastructure monitoring provides metrics, visualizations, and alerting to empower engineers to better understand their systems and ensure optimal performance of their on-premises, cloud, or hybrid environments. With highly granular telemetry data, contextual tagging, data correlation, advanced analytics, and unlimited scalability, Circonus helps teams gain more visibility and troubleshoot faster.

“We recently had an issue with one of our services suffering latencies. We were able to quickly identify several issues, like memory leaks, because we were collecting all the telemetry around that service and alerting on latency. To be able to find that quickly and resolve that issue to ensure that the users engaging with that service were not impacted is a big deal.”

Riley BertonPrincipal SREMajor League Baseball

Set up monitoring with ease

  • Set up your monitoring easily with over 300 turnkey integrations, including databases such as MySQL and Postgres, web servers such as Apache, and operating systems such as Linux and Windows.
  • Get started quickly by deploying the Circonus Unified Agent, which handles all types of host and service monitoring. Run a single command, and the agent will automatically connect to Circonus and metrics will begin flowing.
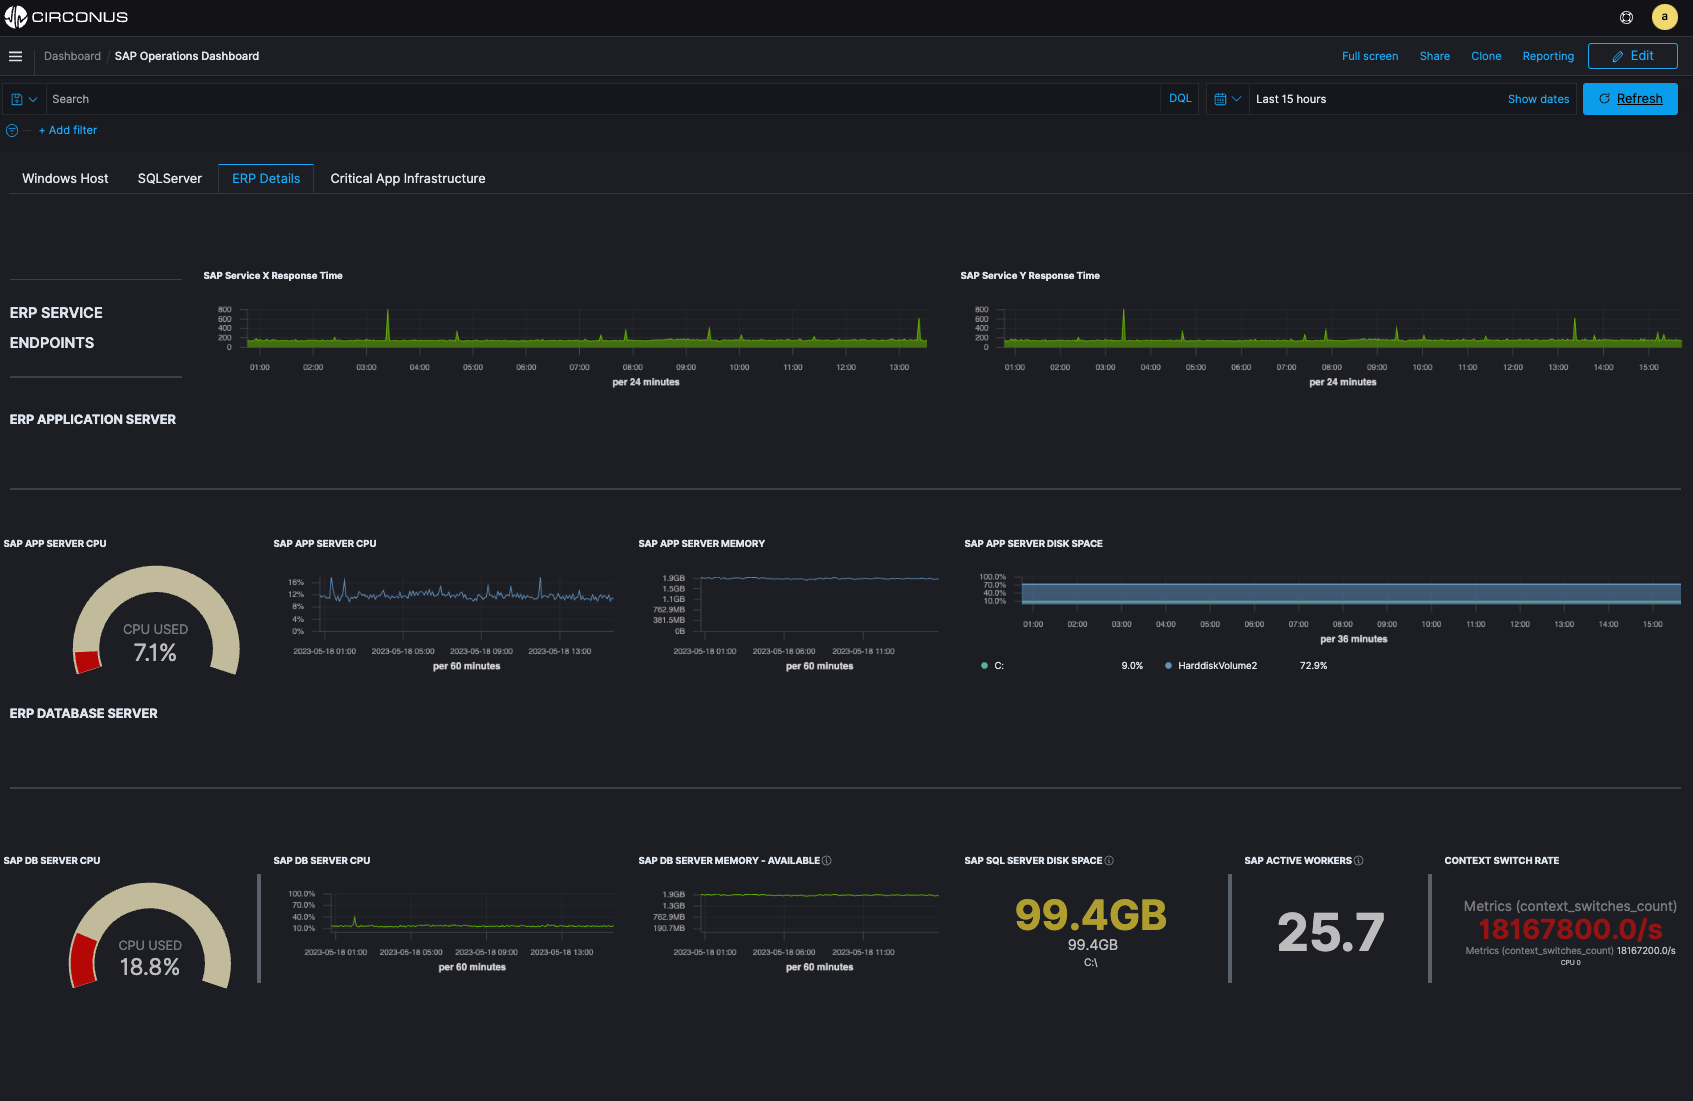
  • Leverage canned dashboards to quickly understand the performance of your systems, services, applications and network.
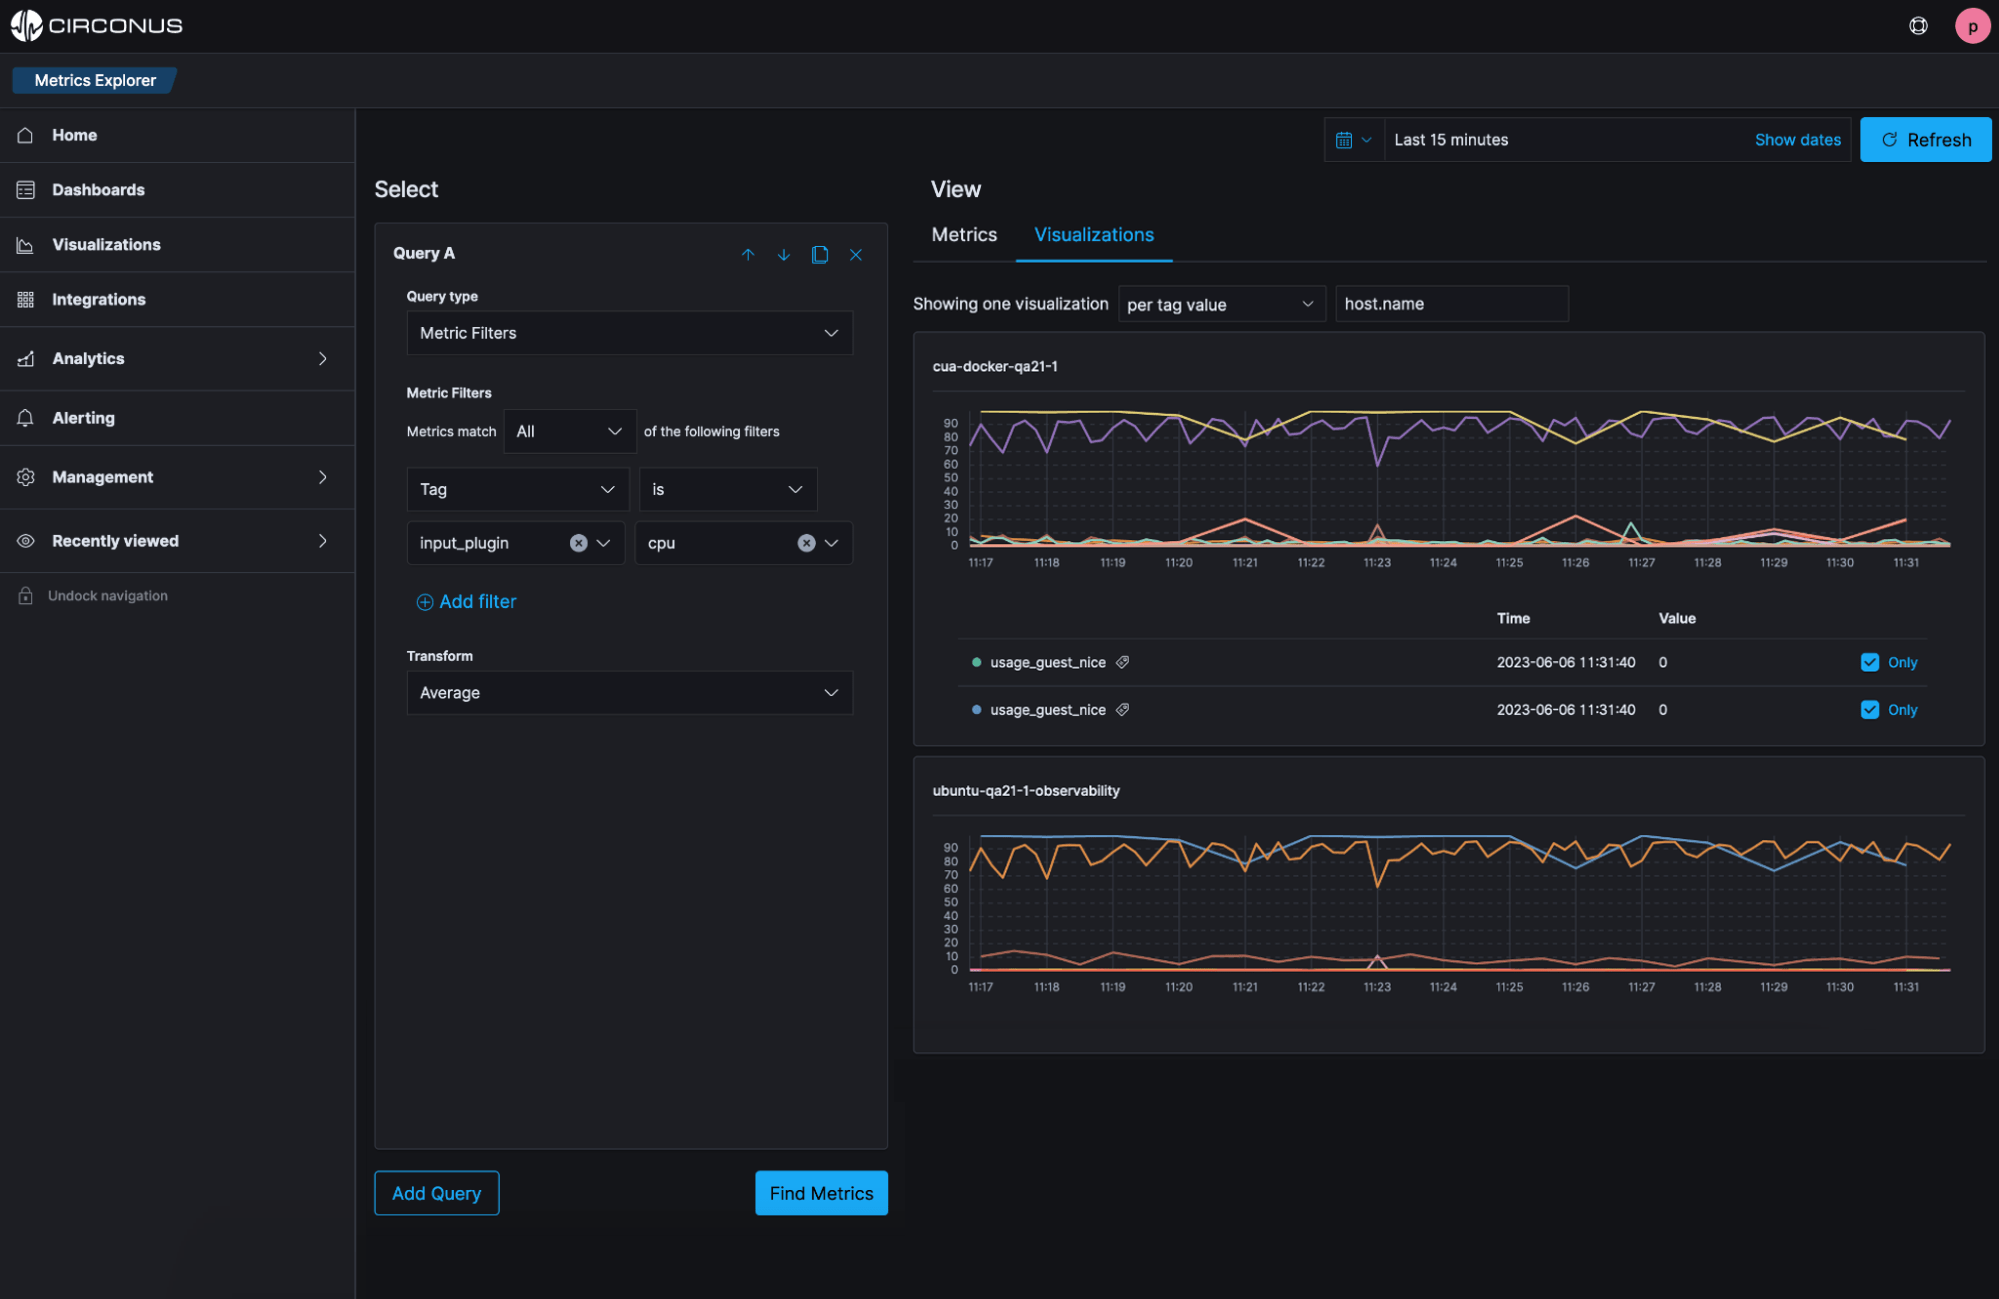
Infrastructure Monitoring Integrations

Identify and resolve issues faster with real-time intelligence

  • Monitor on-premises and cloud infrastructure, physical and virtual machines, applications, and containers in a single platform to unify data, correlate insights, and speed troubleshooting.
  • Find disruptions and concentrations, bottlenecks, errors, latencies, and extreme system loads or drop-offs— all in real time.
  • Easily manage alerts and notifications with alerting integrations such as Pager Duty, Victorops, and Opsgenie, as well as Slack, email, SMS, webhooks, and more.
  • Slice-and-dice complex infrastructure metrics easily with tag-based search and analytics.
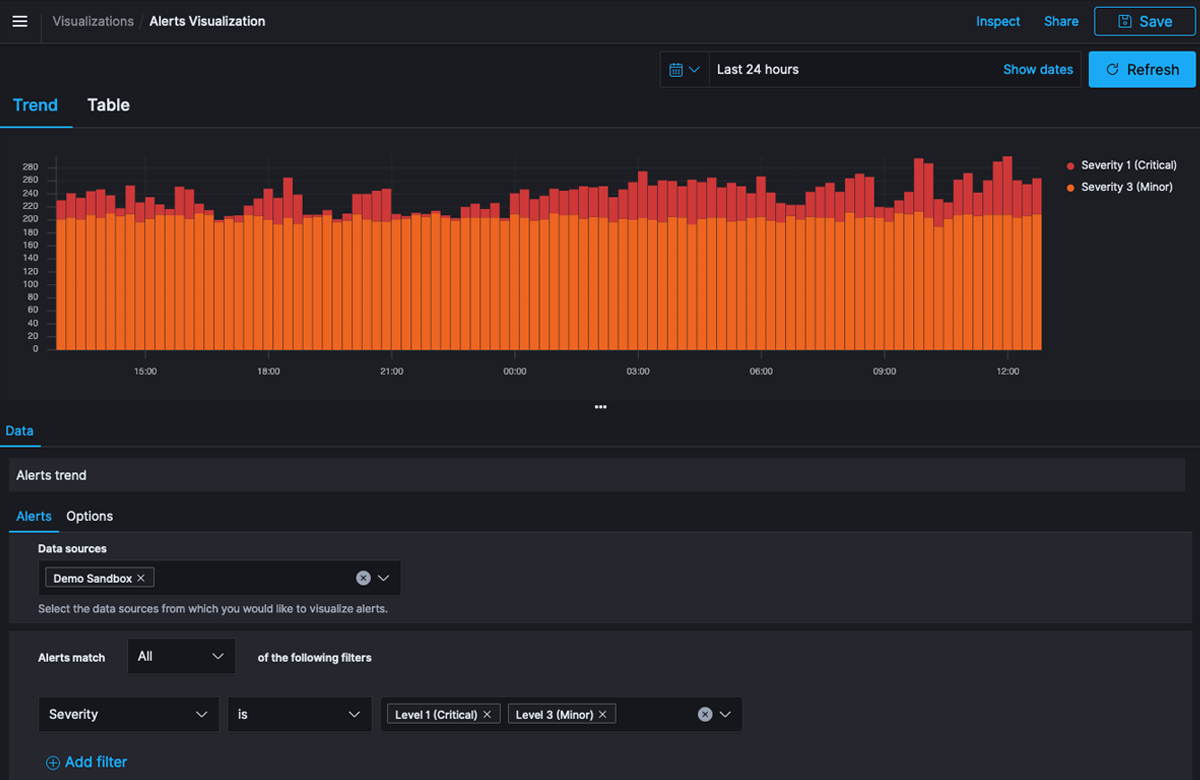
Infrastructure Monitoring Alerts

Leverage advanced analytics to gain deeper insights and improve customer experiences

  • Review past performance for more accurate capacity planning and view long-term trends using historical data.
  • Use histograms to collect all source data, so you can calculate arbitrary and inverse latency percentiles on-demand and manage SLOs and error budgets.
  • Leverage histograms to visualize real-time and historical latency data to determine SLO compliance.
  • Create customized and powerful queries using the Circonus Analytics Query Language (CAQL), which enables users to analyze years of data quickly and easily.
Histogram Latency

Get the flexibility and scale you need

  • Ingest trillions of measurements per second in real-time with unlimited scale and unlimited retention, and of metric data.
  • Track billions of infrastructure metrics out-of-the-box.
  • Collect, visualize, and alert on any metric data from any application and system in real time, including availability, response times, reliability, error rates, and throughput.
Infrastructure Monitoring Scale

IT Infrastructure Monitoring Resources

How to Make the Journey from Basic to Advanced Infrastructure Monitoring

How to Make the Journey from Basic to Advanced Infrastructure Monitoring

The Art and Science of the Service Level Objective

The Art and Science of the Service Level Objective

Monitoring in a DevOps World

Monitoring in a DevOps World

Trusted by industry leaders worldwide

Smugmug Logo
MLB Logo
Xandr Logo
HBO Logo
Redfin Logo

Hundreds of Integrations

GCP
Graphite
Kubernetes
CollectD
Docker
Cisco

See where Circonus can take you.

Learn how monitoring without limits can drive new levels of value and impact in your business and operations.

Free Trial Circonus Sandbox