Intelligent Kubernetes Monitoring

Monitor and improve Kubernetes health, performance, and costs with unparalleled ease and speed.

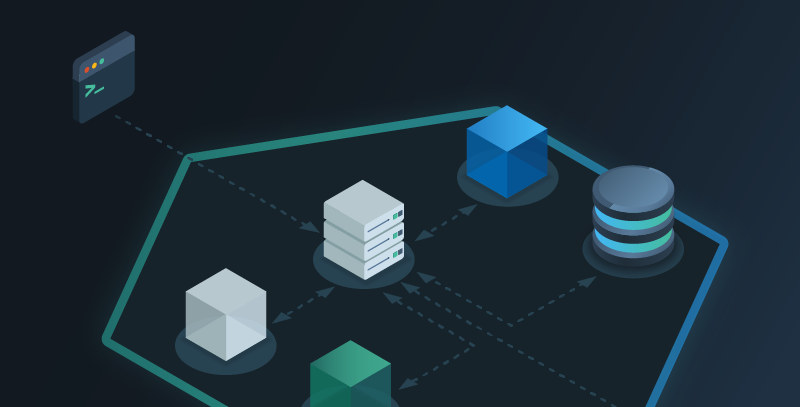
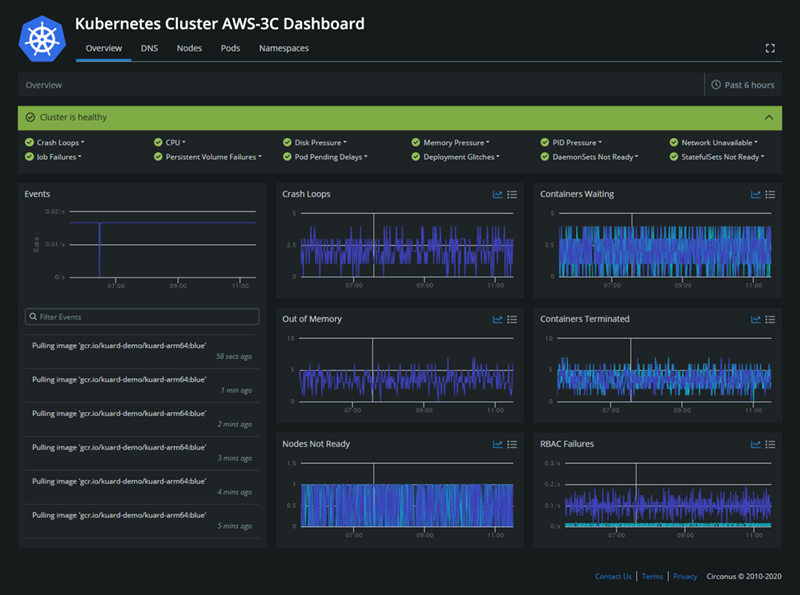
Circonus addresses the complexities of Kubernetes so you don’t have to. Out-of-the-box dashboards and alerts automatically analyze, graph, and alert on the most critical K8s logs, metrics, and traces, so you don’t spend time filtering through unnecessary data. Immediately surface clear, actionable insights that empower you to solve issues quickly and meet reliability requirements.

Kubernetes Dashboard

Optimize performance and cost

  • Real-time operational and health dashboards visualize node and pod resource data for easy-to-consume insights.

  • Explore performance metrics for your cluster, or drill down to a given namespace, application, node, or pod.

  • Leverage deep visibility into resource utilization and application metrics to reduce excess capacity, optimize provisioning, and reduce spend.

Troubleshoot faster

  • View health-check insights such as crash loops, disk and memory pressure, job and volume failures, errors, pod pending delays, and more.

  • Alerts instantly notify you when clusters become unhealthy and link to the dashboard where you can diagnose the issue.

  • View different charts to identify trends, outliers, patterns, and changes over time.
Kubernetes Health

Scale effortlessly

  • Enjoy unlimited scalability to collect the large volume of high-cardinality data.

  • Drive auto-scaling based on rich historical data analysis with unlimited metric retention.

  • Automatically detect changes — whether it’s a new deployment or new Kubernetes releases — and continue monitoring without interruption.

How SREs Can Achieve More Success by Implementing Modern Monitoring

Deploy with ease and speed

  • Easy-to-install agent is ready to go in 10 minutes or less and data immediately begins to populate graphs.

  • Turnkey alerting and dashboards are available out-of-the-box with zero set-up or configuration required.

  • Minimum configuration with initial (and ongoing) service discovery.
Kubernetes Install

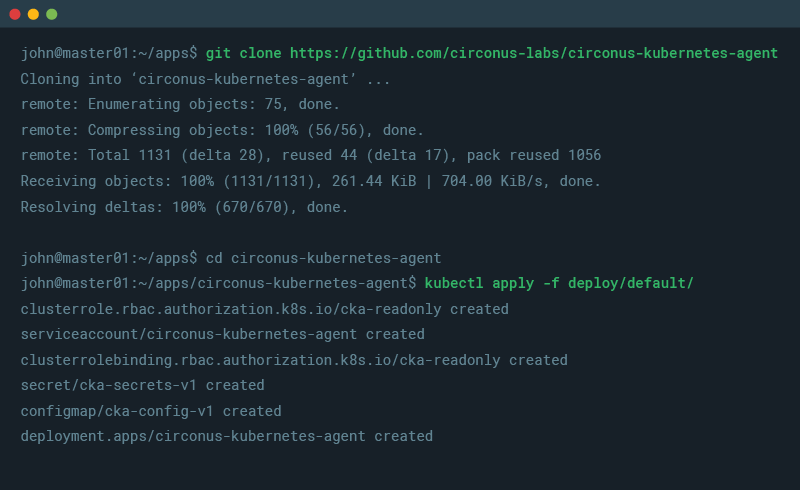
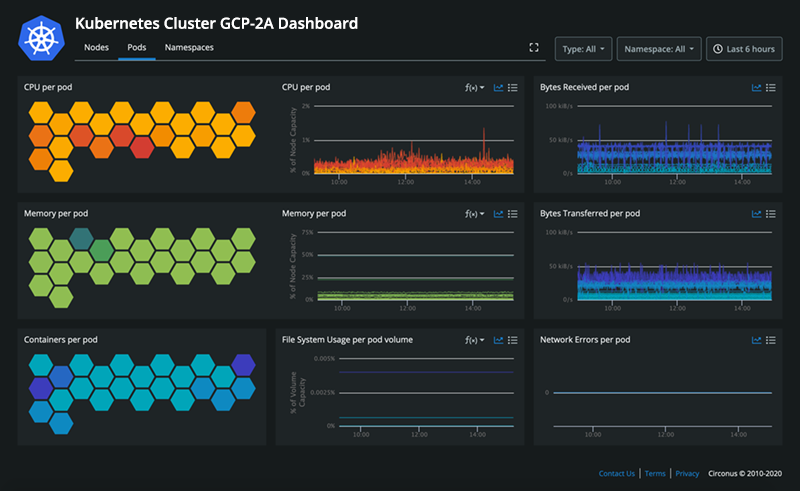
All we do is simply drop an agent onto the cluster and immediately we get alerts, visualizations, and data insights with no extra work on our end. We can launch a cluster and already have the 15-20 important alerts that matter set up. If something is broken, we’re alerted and can view dashboards to identify what the issue is and how to fix it. And if we want to customize further, we easily can.

Riley Berton, Principal SRE
Major League Baseball

See where Circonus can take you.

Learn how monitoring without limits can drive new levels of value and impact in your business and operations.