Instantly consolidate all your observability data across your on-premises and cloud environments into one platform, so you can run queries, set alerts, and compare data through a single pane of glass.
Monitor public, private, and hybrid cloud environments
Most organizations today have multi-cloud and/or hybrid cloud environments. Unfortunately, many are still using different tools to monitor each, inevitably leading to visibility gaps and manual correlation during times of performance issues.
Circonus consolidates all of your metrics, traces, and logs from across all of your on-premises, private cloud, and public cloud environments. Our unified dashboard provides a single pane of glass to correlate all of this data, so teams can improve collaboration and resolve issues faster.
Scale with ease
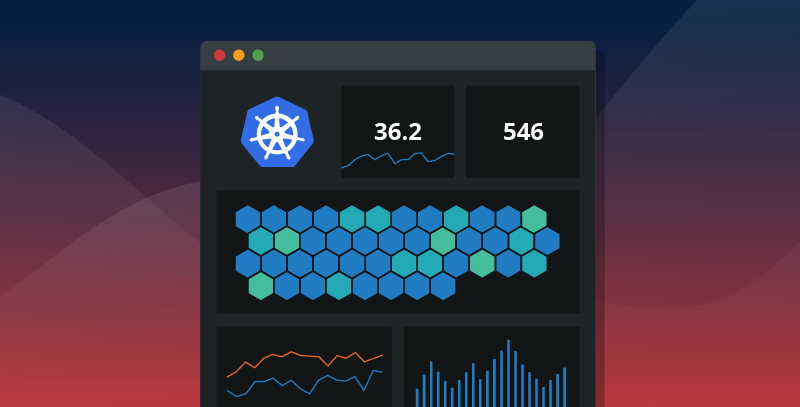
Cloud environments are constantly evolving and generating significant amounts of telemetry. Traditional monitoring tools cannot keep pace with these changes, or collect data at the scale required for accurate visibility into hybrid cloud environments. Circonus ingests telemetry at unlimited scale and un-matched granularity (trillions of measurements per second), allowing you to catch what other solutions would miss.
Because our platform detects changes and autodiscovers all new cloud instances and containers, you and your teams can monitor without interruption as your environment changes or grows.
Open standards provide flexibility
Circonus is built on open standards, reducing vendor lock-in while empowering your teams with the tools they’re already familiar with. Circonus supports open source collection agents including Prometheus, Telegraf, Fluent Bit, Data Prepper, Logstash, and OpenTelemetry. So if you’re already using these tools, they’ll seamlessly work with Circonus, which will ingest and unify all of this data from across all your environments.
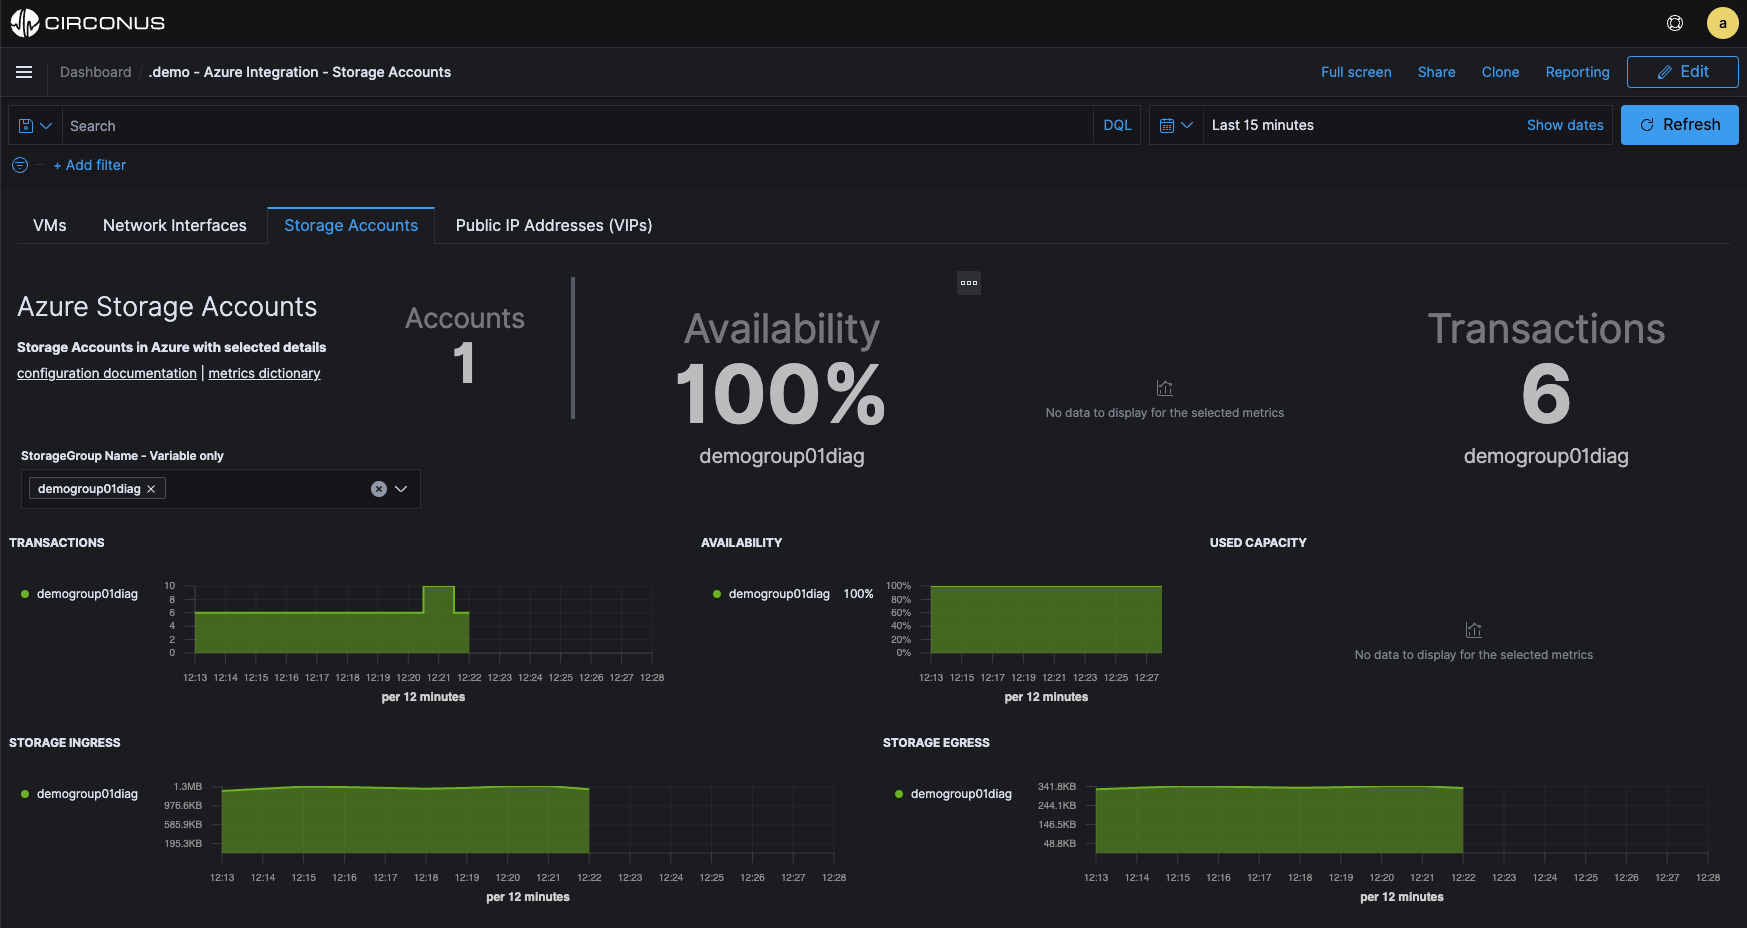
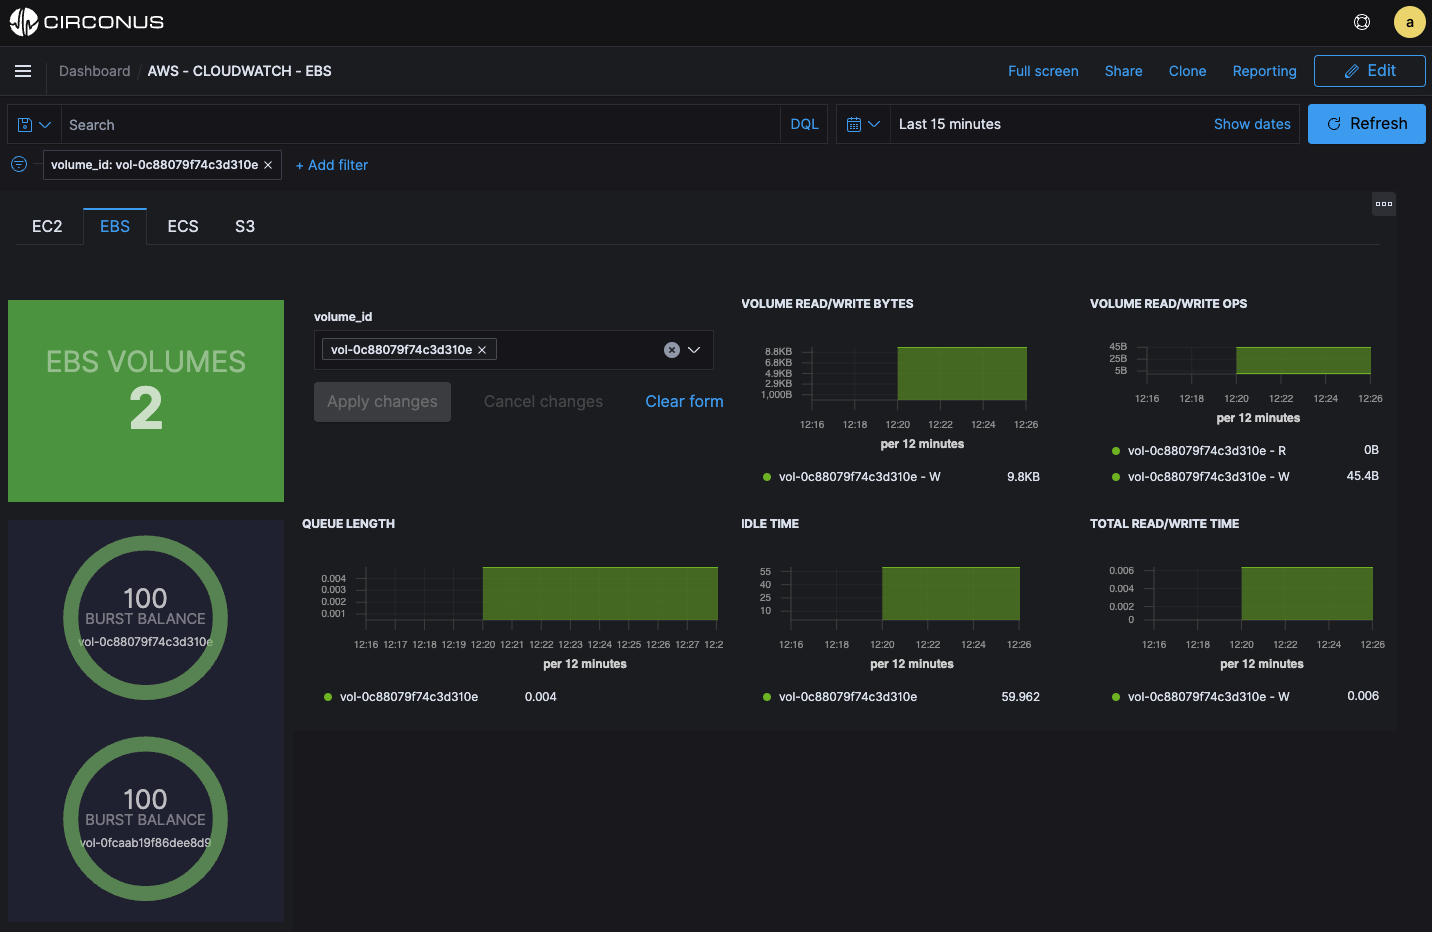
Visualize and analyze all your data quickly using our out-of-the-box dashboards based on OpenSearch and our support for standard query languages like DQL, PPL, Lucene, and PromQL.
How SREs Can Achieve More Success by Implementing Modern Monitoring

Quickly filter, search, and correlate data
Circonus provides powerful capabilities to quickly access the data you need from across your cloud and on-premises systems, applications, and containers. Using the Elastic Common Schema, Circonus tags metadata to each item you monitor, so you can leverage tags to quickly compare and contrast performance, slice and dice data, build queries and visuals, and establish relationships between data and components across environments that enable accurate correlation and faster troubleshooting.
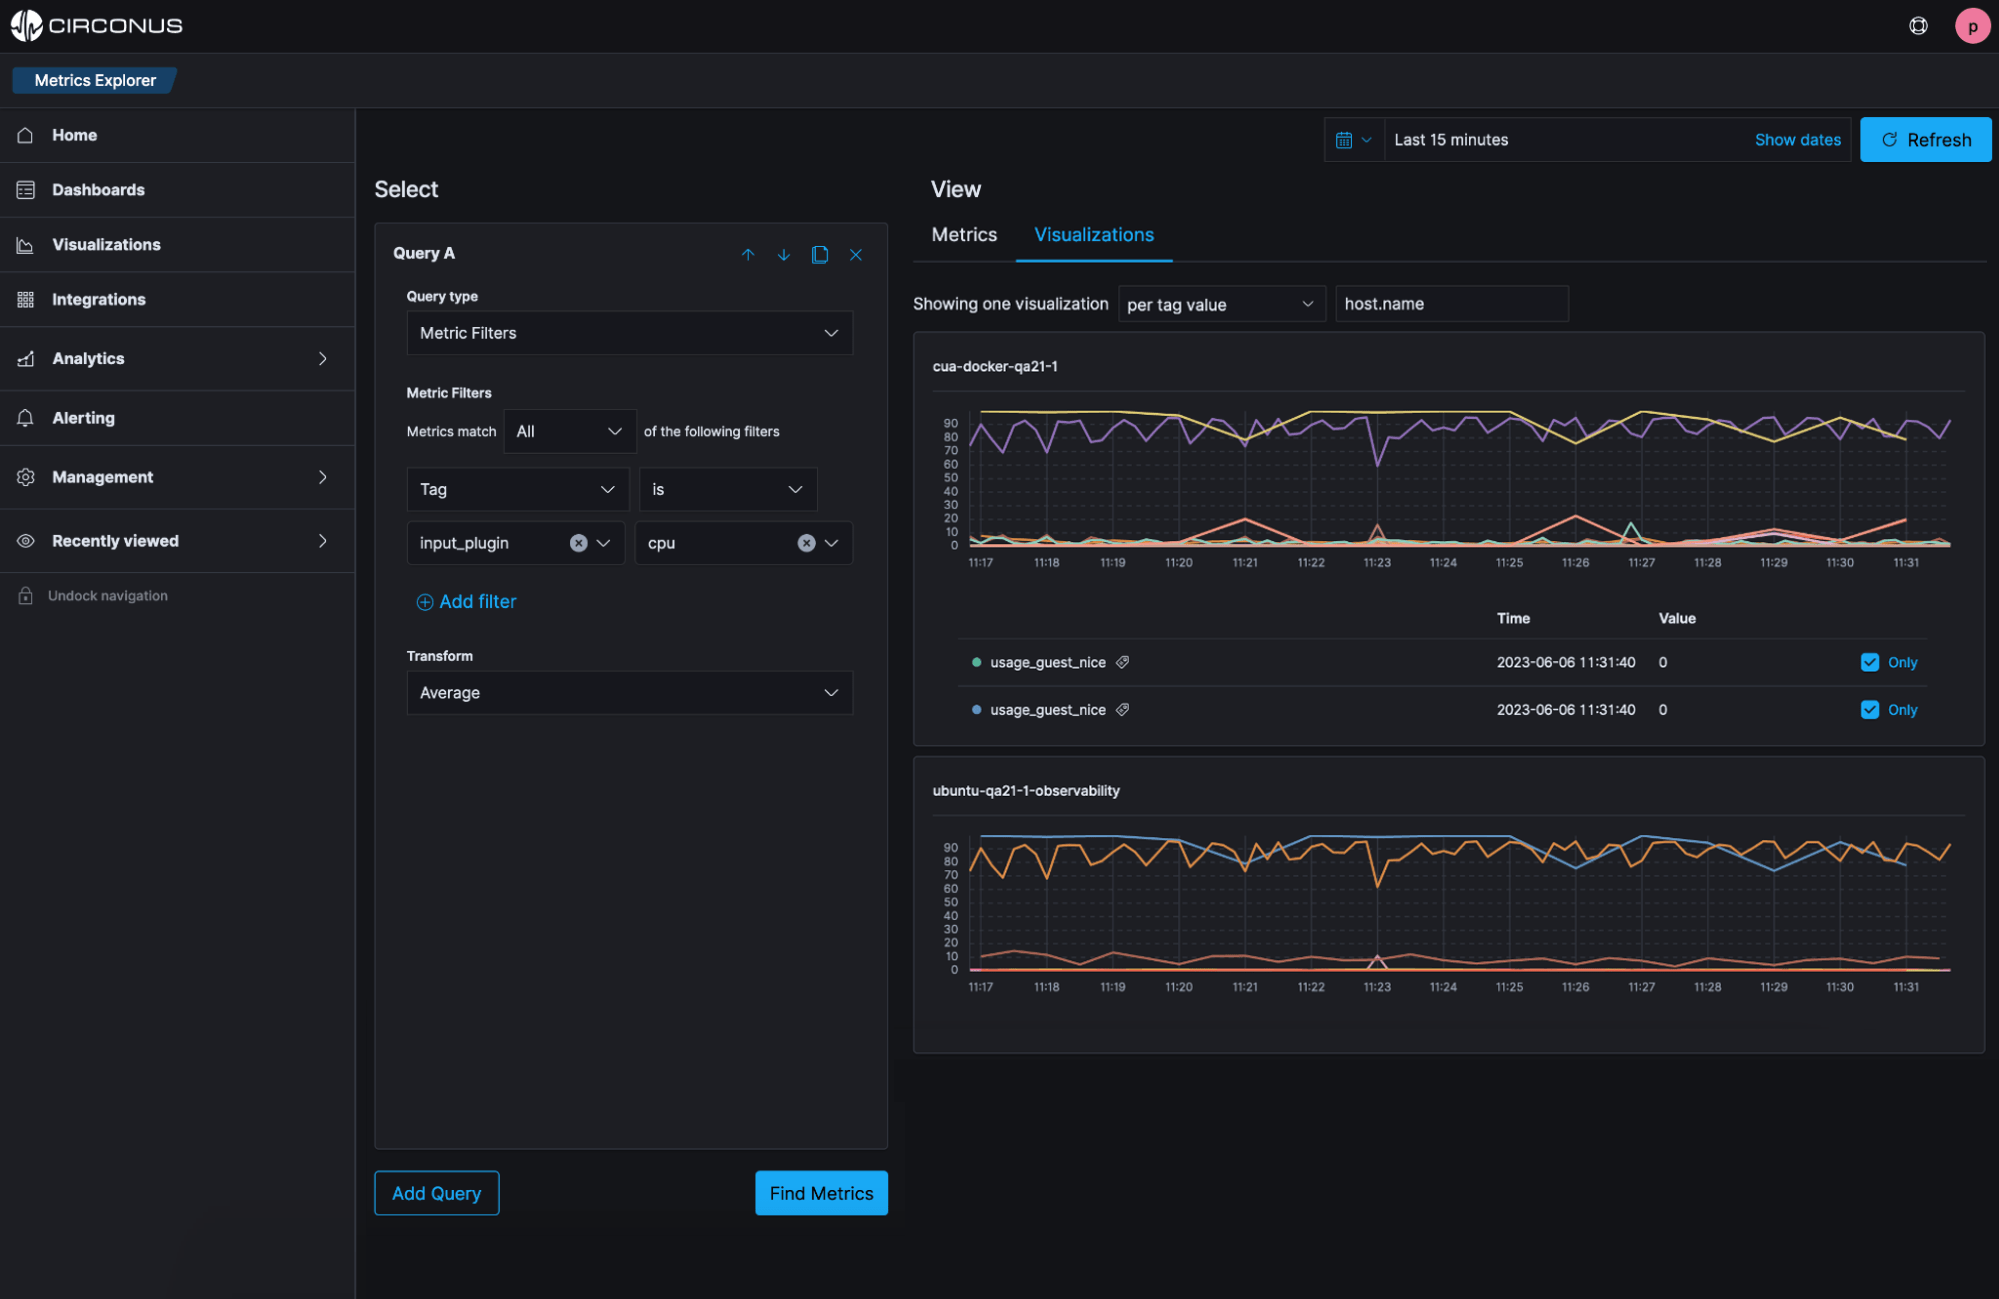
Within our Metrics Explorer, you can quickly visualize and search all of your metric data across clouds in our easy-to-use “metrics playground” interface. You can view metric tags and run customizable queries to understand the right data and time window to explore, which new metrics you should track, and how metric behavior is correlated or has changed.
We are trying to eliminate tools, not add more. It’s so easy to collect Google Cloud metrics using Circonus, so we have a single platform to run queries, set alerts, and review data.
Riley Berton, Principal SRE
Major League Baseball