
One of the hardest challenges in computer science is deciding what to name things. Adoption of consistent nomenclature is difficult because there is no one right answer. In fact, it’s not uncommon for different teams within organizations to choose different names for the same technologies. In the world of monitoring and observability, this can create quite a lot of confusion – not to mention wasted resources.
Not having a consistent nomenclature was not as significant of an issue in the past as it is today. Observability now spans different data sets – metrics, traces, and logs – and many teams are using several commercial and open source different monitoring tools. The reality for practitioners is they must correlate across multiple data types that exist in different systems and that are managed by different teams.
As a result, what and how you name things becomes essential to getting the value out of the data you send.
You can always send more data, but if you can’t access it and you can’t search it, then you’re wasting money and introducing risk.
Lack of a consistent schema reinforces silos and inhibits teams from effectively using their data to identify and resolve incidents. In the following post, I share a few of the essential reasons why observability teams require a consistent schema when enriching their data with tags.
Faster Correlation = Faster MTTR
Tags are just a way of organizing data. You can build more sophisticated structures on top of them, but they really are just key value pairs. Tagging should be data type agnostic. You may have tags associated with trace data, with log data, and with metric data – and if they’re all referring to a host that is compliant with the consistent nomenclature schema for what to call a host, then correlating that data when troubleshooting is significantly easier.
For example, if a host is suffering performance issues, you simply filter on that key across the three data types and even across different databases and technologies, and immediately view the relevant metrics, traces, and logs.
When a user needs information about a host or service in the production environment, having tags that are consistently applied across data types results in faster, more accurate correlation – an invaluable benefit when resolving issues that can potentially become costly outages.
More powerful reporting & collaboration
Say you pull up a dashboard of the performance utilization of production servers and one team has tagged their data with “host_name,” while another team has called it “host.” Your observability tools will not inherently know that these tags refer to the same thing. This obviously makes reporting a bit challenging.
Teams are forced to spend time manually making sense of the data, or writing more complicated queries to account for differences in naming conventions, often resulting in missed insights. Consistent tagging unlocks them from this burden and allows users to quickly create more powerful reports that can span different business units. This improved cross-team collaboration enables deeper insights that can ultimately optimize operations and proactively protect your revenue-generating services.
Better performance
Having a consistent tagging schema has an implication on the number of fields in your templates, as well as on your index sizes. In general, fewer unique categories in which to place data means that less data needs to be indexed, resulting in less disk usage and better performance.
More data ownership & portability
Data ownership goes beyond where your data is being stored. Data collection is as important, if not more important, than where you send your data. You really don’t own your data if it needs to conform to a very specific vendor’s implementation. Therefore, a tagging schema that embraces open standards gives you the option to more easily take or send your data wherever it needs to go now and into the future.
At Circonus, we built our platform to be Metrics 2.0 compliant, meaning that we tag metadata to each item we monitor. We chose the Elastic Common Schema (ECS) as our metadata schema because it’s an open standard already familiar to so many engineers. In April 2023, Elastic announced it was contributing ECS to the Open Telemetry (OTEL) project.
The adoption of an open source data schema helps address challenges so many observability teams face around migrating data and manually unifying data. Creating a common language simplifies every aspect of data ownership, from ingestion to analyzing, storing, and migrating.
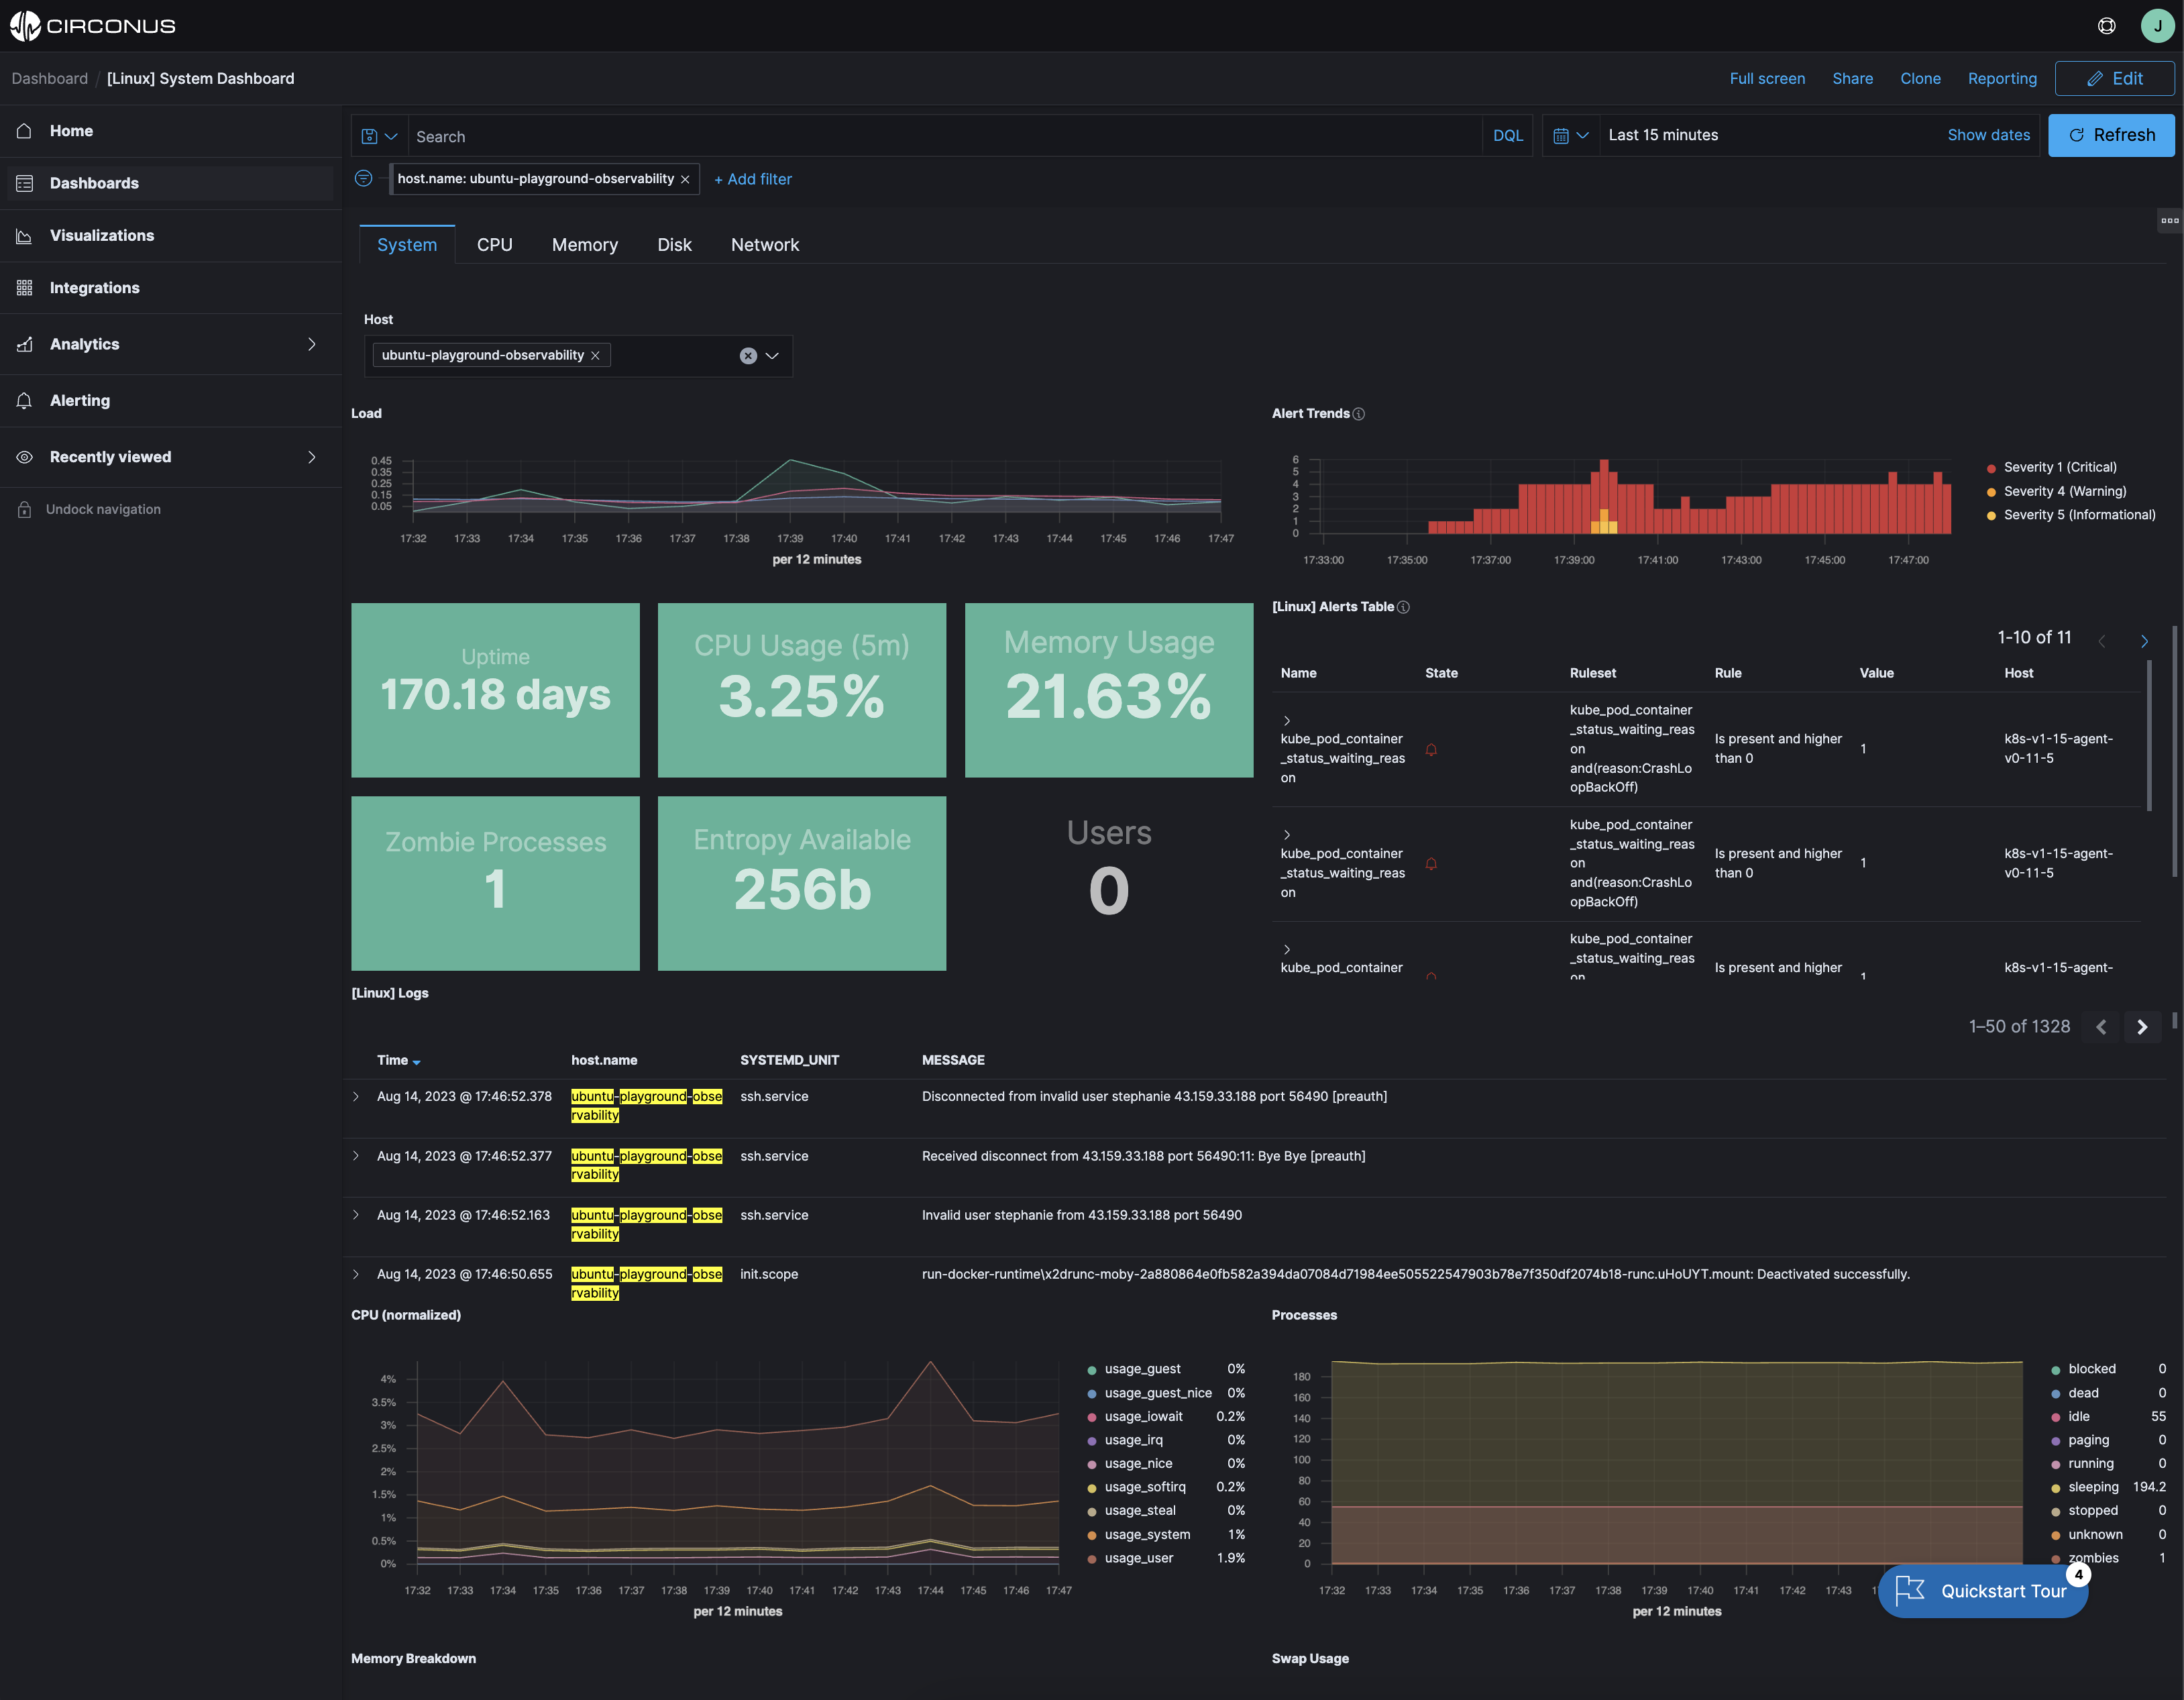
Example: A peak inside Circonus’ ECS implementation
Because Circonus tags data with a consistent schema, our users can query all their data using the same schema and quickly establish relationships between components and metrics, traces, and log data.
For example, the following screenshot shows the outcome of using the ECS host.name tagging with metrics and logs. This gives context (logs) to the associated metrics. The host.name here is ubuntu-playground-observability. When the dashboard filter is applied to a specific value, all metrics and logs are filtered to that value for a specific host/vm/pc.
You can explore this yourself in the Circonus sandbox here.


