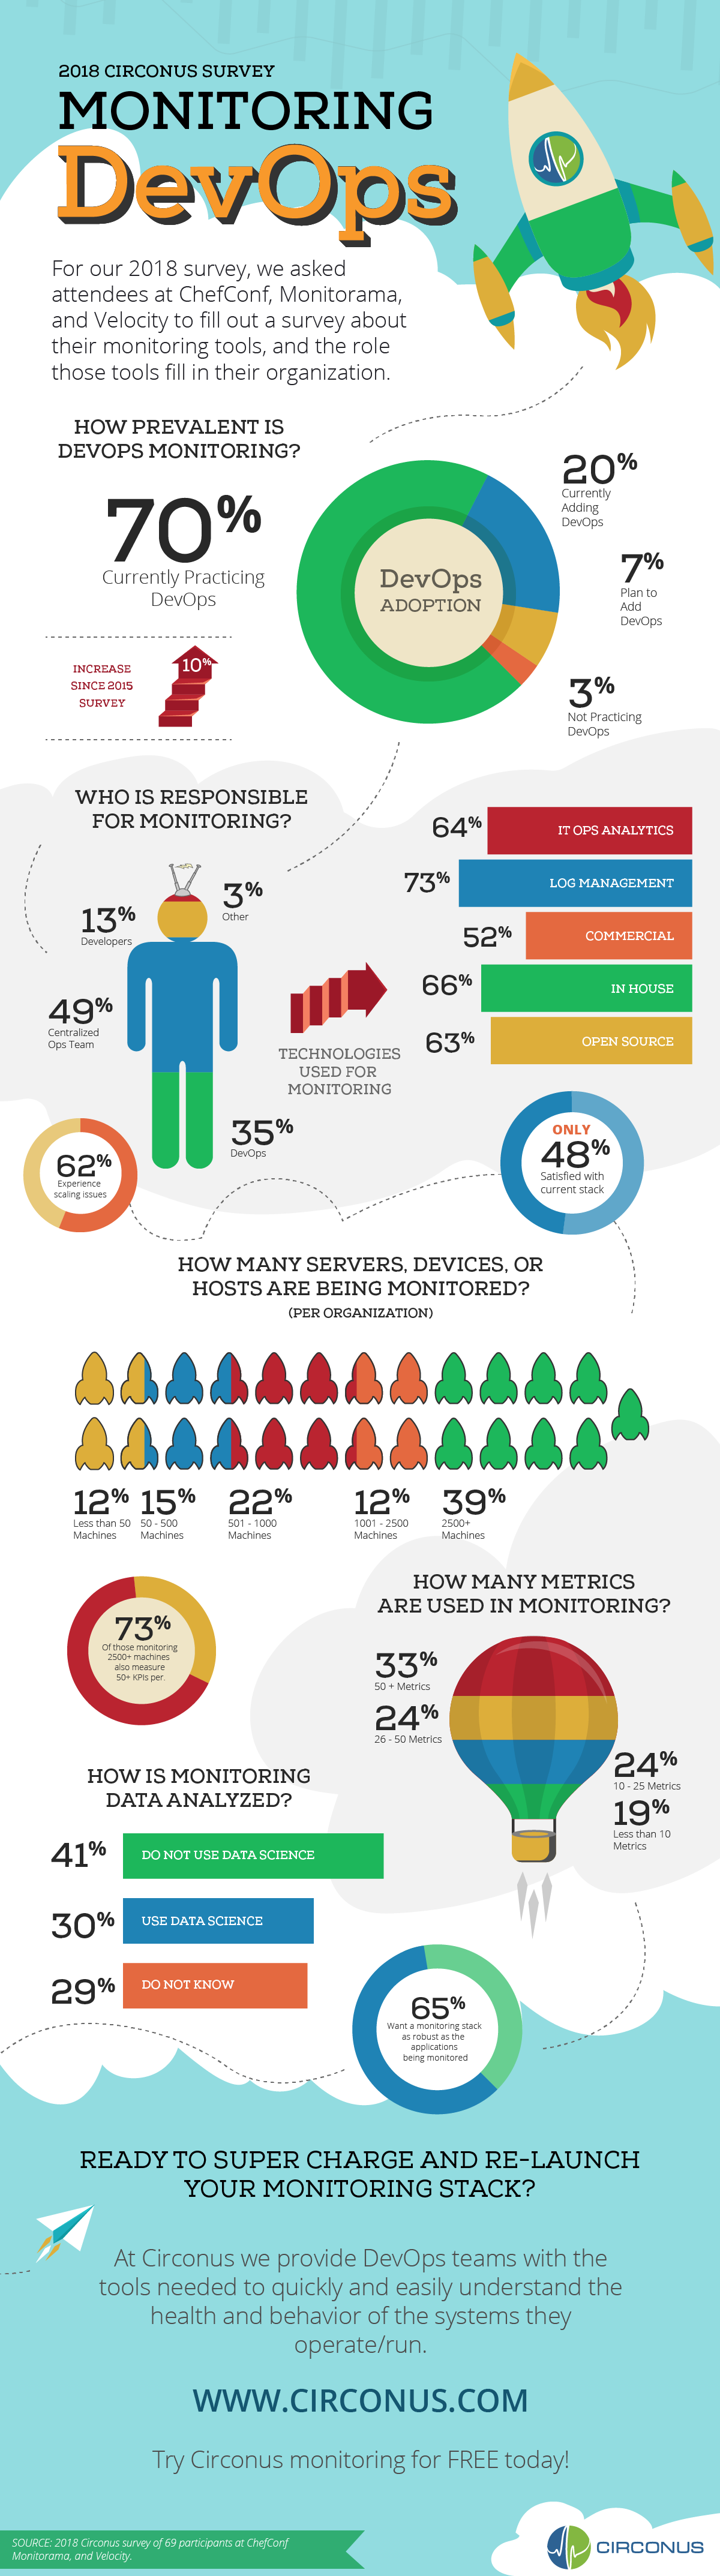
Our first DevOps & Monitoring Survey was conducted at ChefConf 2015. This year, we’ve created an infographic based on the facts and figures from our 2018 Monitoring DevOps Survey. The infographic provides a visual representation of the prevalence of DevOps, how monitoring responsibilities are distributed, metrics usage, and various aspects of current monitoring tools.
This infographic describes insights into strategies used by others in our community. Let us know what you think, and feel free to share it with your friends.