
This article was originally published in APM Digest here. Multicasting in this context refers to the process of directing data streams to two or more destinations. This might look like sending the same telemetry data […]

Dynamic observability is the concept that the amount of data collected should scale based on signals from your environment. Elastic infrastructure is not a new concept. Much of the internet is powered by services that […]
A truism amongst operations professionals is that any alert your observability platform produces should be actionable, otherwise it is just noise. Auto-remediation is a hard problem, so the most common action triggered by an alert […]

One of the hardest challenges in computer science is deciding what to name things. Adoption of consistent nomenclature is difficult because there is no one right answer. In fact, it’s not uncommon for different teams […]

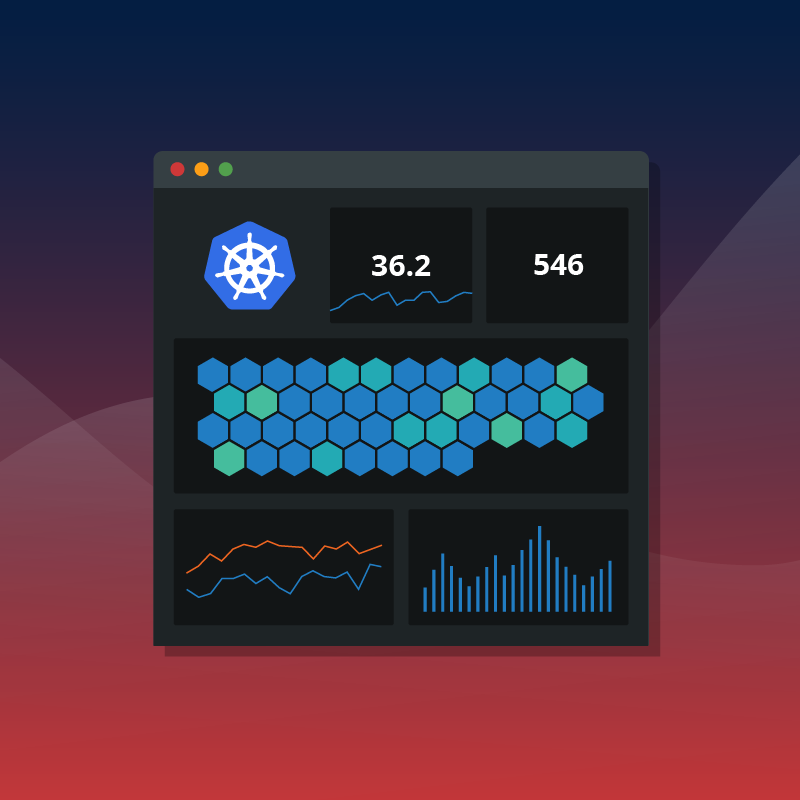
While Prometheus has been available since 2012, its popularity has skyrocketed in the last five years as it became the de facto solution for Kubernetes. Although Prometheus may be suitable for smaller environments, it was […]
Millions of baseball fans tuned into the World Series last week, and we at Circonus were proud to help our customer, Major League Baseball, provide those fans with seamless viewing experiences. To celebrate our partnership, […]

Many organizations relying on Graphite will be leveraging telemetry provided through Statsd. And if you rely on Graphite in combination with StatsD telemetry, you’re likely suffering from aggregation bloat. In a typical Graphite ingestion pipeline, […]

Graphite is a free open-source software (FOSS) tool that monitors and graphs numeric time-series data. Graphite was originally a project developed internally at Orbitz in 2006, which eventually grew to be their foundational monitoring tool. […]
Circonus is a full-stack monitoring solution for the modern-day enterprise that delivers crystal-clear, real-time observability of the behavior, health, trends, and performance of the entire enterprise footprint from edge to edge in one unified platform.
40 Lloyd Avenue, Suite 306
Malvern, PA 19355
888-840-8133