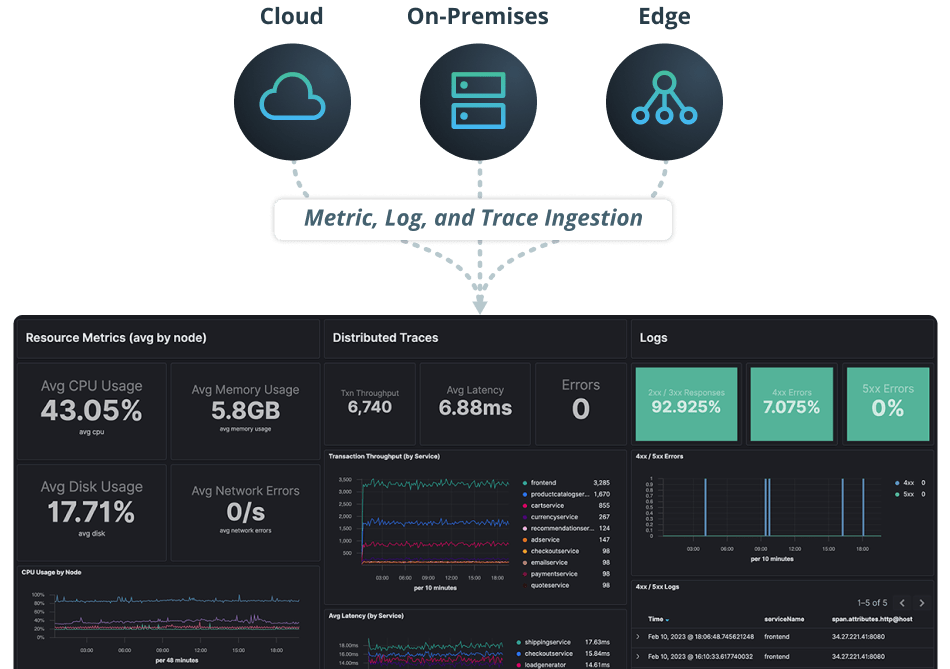
Collect metrics, logs, and traces from your systems, applications, network, and 3rd party APIs, whether on-premise, in the cloud, or at the edge. Use CUA or use the open source collection agents you already have with support for Fluent Bit, Data Prepper, and OpenTelemetry.
Metric Ingestion
The Circonus Unified Agent
The Circonus Unified Agent (CUA) is an open source agent for collecting metrics and writing them to the Circonus service. CUA collects metrics through various input plugins, allowing Circonus customers to monitor systems, services, and 3rd party APIs.
CUA can be installed by a single line command within containers, hosts, or in the cloud. CUA can handle billions of records per second and has out-of-the-box support for over 300 different integrations.
Open Source Support
Circonus also supports open source metric collection agents including Prometheus, Telegraf, StatsD, collectd, or any agent that supports a JSON payload.
Log Ingestion
Log ingestion provides a way to transform unstructured log data into structured data, which allows for improved queries and filtering, and accelerates time to resolution of incidents when combined with Circonus Log Analytics.
Through our open approach to log ingestion and support for industry standards like Fluent Bit, Data Prepper, and Logstash, Circonus makes it easy to leverage the log shippers you likely have already deployed.
Circonus log ingestion requires either Fluent Bit or Data Prepper to be deployed to collect logs, which are then passed to the Circonus Pipeline Exporter for ingestion into Circonus.
Circonus Log Analytics allows you to visualize errors, latencies, outliers, and other log patterns and save directly to dashboards.
Trace Ingestion
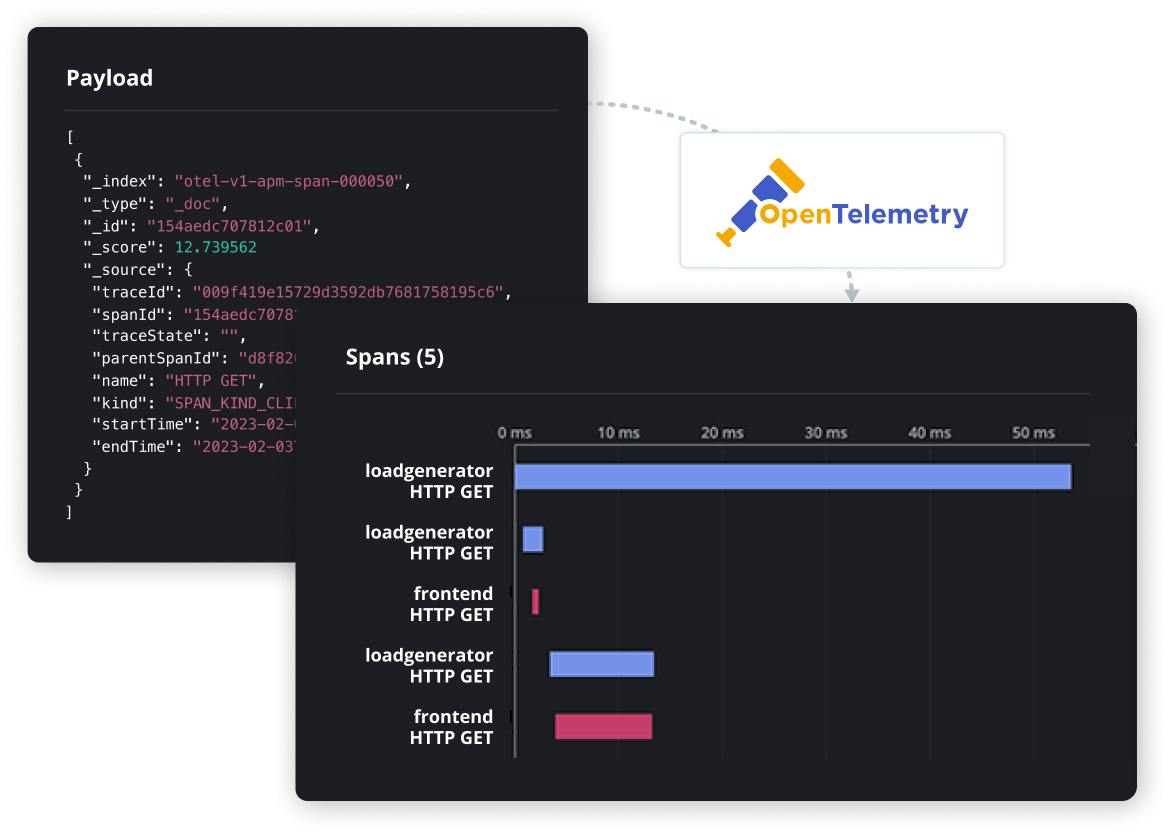
Circonus supports OpenTelemetry (OTel), along with older standards like Jaeger or Zipkin. OTEL is the leading cloud native, vendor neutral, open-source observability instrumentation framework. Once you instrument your applications and they begin emitting trace data, the OpenTelemetry Collector receives the data and formats it into OpenTelemetry data.
The OTEL Collector integrates into the Circonus Pipeline, which then transforms your trace and span data and passes it to the Circonus platform, instantly giving you access to your data for analysis.
Circonus Trace Analytics analyzes trace data and allows you to visualize the service architecture, latency, error rate, and throughput.
You’d be hard-pressed to find a system out there today that can handle the volume of data that we’re throwing into Circonus and still have it perform really well. For me, as an engineer geek, the speed at which everything operates has been amazing.
Riley Berton, Principal SRE
Major League Baseball