This week, we announced the availability of our Spring 2020 release. The highlight of the release is our Kubernetes monitoring solution, which provides health-based alerting and horizontal pod auto-scaling. Additional enhancements include cloud monitoring, GCP Marketplace availability, performance improvements, and a more comprehensive Terraform integration.
Here’s some background on these latest capabilities:
Kubernetes monitoring
The Circonus Kubernetes monitoring solution lets enterprises monitor one or more Kubernetes clusters. It provides turnkey dashboards and alerting for increased visibility into cluster performance and health, and drives dynamic Kubernetes horizontal pod auto-scaling strategies that can be custom-tuned to the unique needs of an organization. Features include:
- Easy-to-install agent
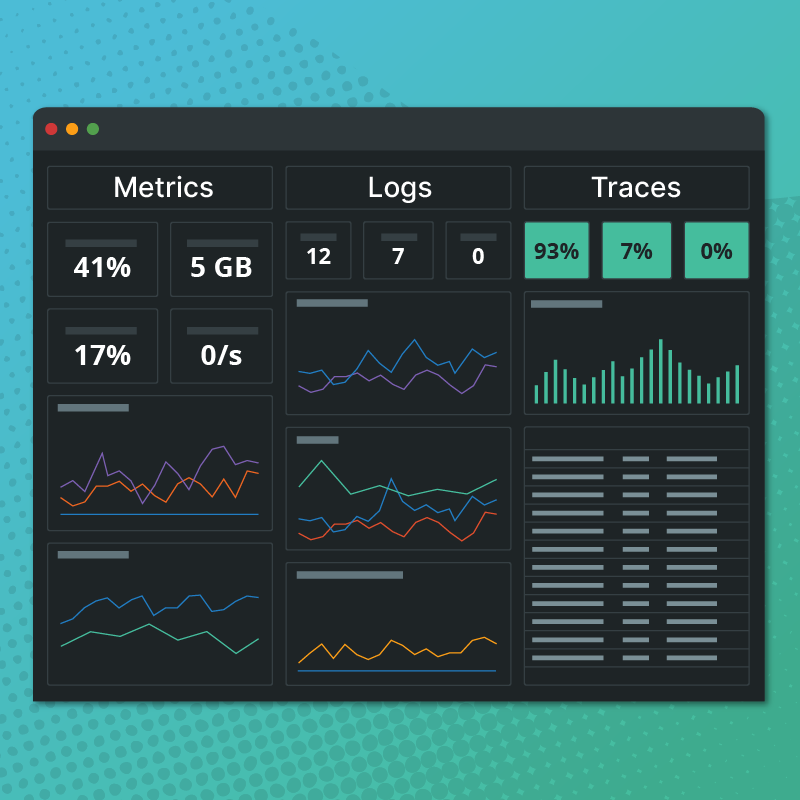
- Immediate, real-time operational and health dashboards
- Turnkey alerting for Kubernetes clusters to ensure Kubernetes remains healthy
- Health-check insights such as crash loops, disk and memory pressure, job and volume failures, errors, pod pending delays, and deployment glitches
- Native StatsD collection support
- Horizontal pod auto-scaling
What makes auto-scaling with Circonus unique is the ability to drive auto-scaling based on rich historical data analysis that customers have stored within Circonus — driving efficient, novel auto-scaling in a way that no other solution currently can. As a result, organizations can create dynamic auto-scaling strategies that will ensure optimal performance, reduce costs, and save time.
Interested in a demo of our Kubernetes monitoring solution? Let us know.

Circonus IRONdb available in GCP Marketplace
Circonus’s IRONdb time-series database is now available in the GCP marketplace, empowering customers to run their own instances of Circonus IRONdb within their private clouds on GCP. Customers can still use the database’s SaaS UI, and the offering enables a new pricing model that allows for unmetered metric ingestion.
Cloud monitoring
Circonus’s cloud monitoring solution includes a cloud agent that provides a lightweight binary through which to easily collect metrics from Amazon Web Services (AWS), Azure, and Google Cloud Platform (GCP), as well as in-application dashboards. Customers can instantly move all of their metrics from multiple clouds into a single platform, enabling them to run queries, set alerts, and compare data from a single place.
Here’s a snapshot of the additional enhancements:
- Performance improvements: Customers can now run analytic queries upon thousands of application metrics in near real time for unprecedented visibility into application performance
- Comprehensive Terraform integration: Extension, documentation, and other improvements have been made to Circonus’s native Terraform provider
- High availability metric ingestion: The Circonus cluster broker is designed to share the load of metric ingestion across multiple brokers, creating a fail-safe if one goes down
- UI refresh: The UI has experienced a refresh with the addition of dark mode as well as responsive behavior across mobile devices.
With these latest enhancements, Circonus becomes the only solution that can collect and analyze IT infrastructure, application, and container data at extreme scale across cloud, on-prem, and hybrid deployments — all in one platform.
Contact us if you’re interested in learning more.