IT outage times are rapidly increasing as businesses modernize to meet the needs of remote workers, accelerate their digitalization transformations, and adopt new microservices-based architectures and platforms. Research shows that mean time to recovery (MTTR) is ramping up, and it now takes organizations an average of 11.2 hours to find and resolve an outage after it’s reported—an increase of nearly two hours since just 2020.
While CIOs rank financial loss as the most severe impact of outages, the study reveals a much broader picture of costs, with customer satisfaction (47%), data loss (45%), and loss of reputation (41%) also cited as main impacts.
Furthermore, according to a recent report by eMarketer, “recent outages aren’t just more frequent—they have also been taking longer to resolve than previously, indicating that massive growth is quickly becoming unmanageable even for companies with considerable resources.”
What’s driving this increase in outage resolution time?
As digital transformation efforts have caused IT environments to become more complex, the amount of log data they are monitoring — which is critical for resolving issues — has increased substantially.
Unfortunately, as the volume, velocity, and variety of logs have increased, it has become incredibly challenging for today’s enterprises to efficiently analyze and alert on their log data. This includes identifying which log data is important to take action on, and correlating log data with metrics and traces, as all three together are critical for identifying and resolving issues. As a result, MTTR continues to rise.
What is log monitoring and how is it used?
Log monitoring is the process of collecting, analyzing, and storing logs generated by various IT systems and applications. Logs contain valuable information about the behavior and performance of IT systems, as well as events and activities that occur within those systems.
Logs are used for various purposes such as troubleshooting, security monitoring, audit trails, and performance analysis. If stored, they provide a historical record of what has happened within an IT system, which is essential for understanding and resolving problems. Logs can also be used to identify security threats, detect performance bottlenecks, and gain insights into the behavior of IT systems and users.
Logs are costly and noisy
As businesses began generating more log data, they turned to log centralization tools, which bring all of their log data into a single database and enable them to find patterns within that data.
However, log centralization requires both transmitting and storing log data—something that has morphed from a gigabyte-sized problem into a petabyte-sized problem, causing it to become incredibly complex and expensive.
Given the expense of transmitting and storing log data, most enterprises choose to consistently discard it after short periods of time, as well as during periods of heavy volume, when such data is incredibly important but increases dramatically in terms of both volume and cost. In fact, many IT teams these days are focused more on staying within their allotted budgets than they are with retaining the log data they most need.
Another reason organizations discard large amounts of log data—often in as little as 24 hours—is because the data frequently includes personally identifiable information (PII), the storage of which poses significant legal risk.
Historical data provides crucial business insights that help not only speed troubleshooting, but also prevent future performance issues. If an error for a critical business application happens once, it may be of no real concern. However, if it happens 1,000 times, you should surely be paying attention. Knowing this information requires the storage of historical log data. But, it’s often nonexistent.
Even if organizations retained all of their log data, they would still need to manually sort through it to pull out relevant insights. The sheer volume of logs these days makes this incredibly difficult, resulting in a poor signal-to-noise ratio and reduced accuracy. It also leaves IT teams struggling to identify what information is important, often in situations where time is of the essence.
Converting log data into metrics
While metrics, logs, and traces together are essential for full observability, metrics offer a couple key advantages. First, you can perform more sophisticated analysis on them; and second, they are super cheap to store compared to logs. Why? A single number may represent an entire page or more of log entries when processed, so 4, 6, or 8 digits replaces up to 3,000 characters (approx. 60 characters per line at 50 lines). A reduction of 400+ is a huge difference when you consider that it’s not uncommon today for a server to produce 10+ Gigabytes a day of logs.
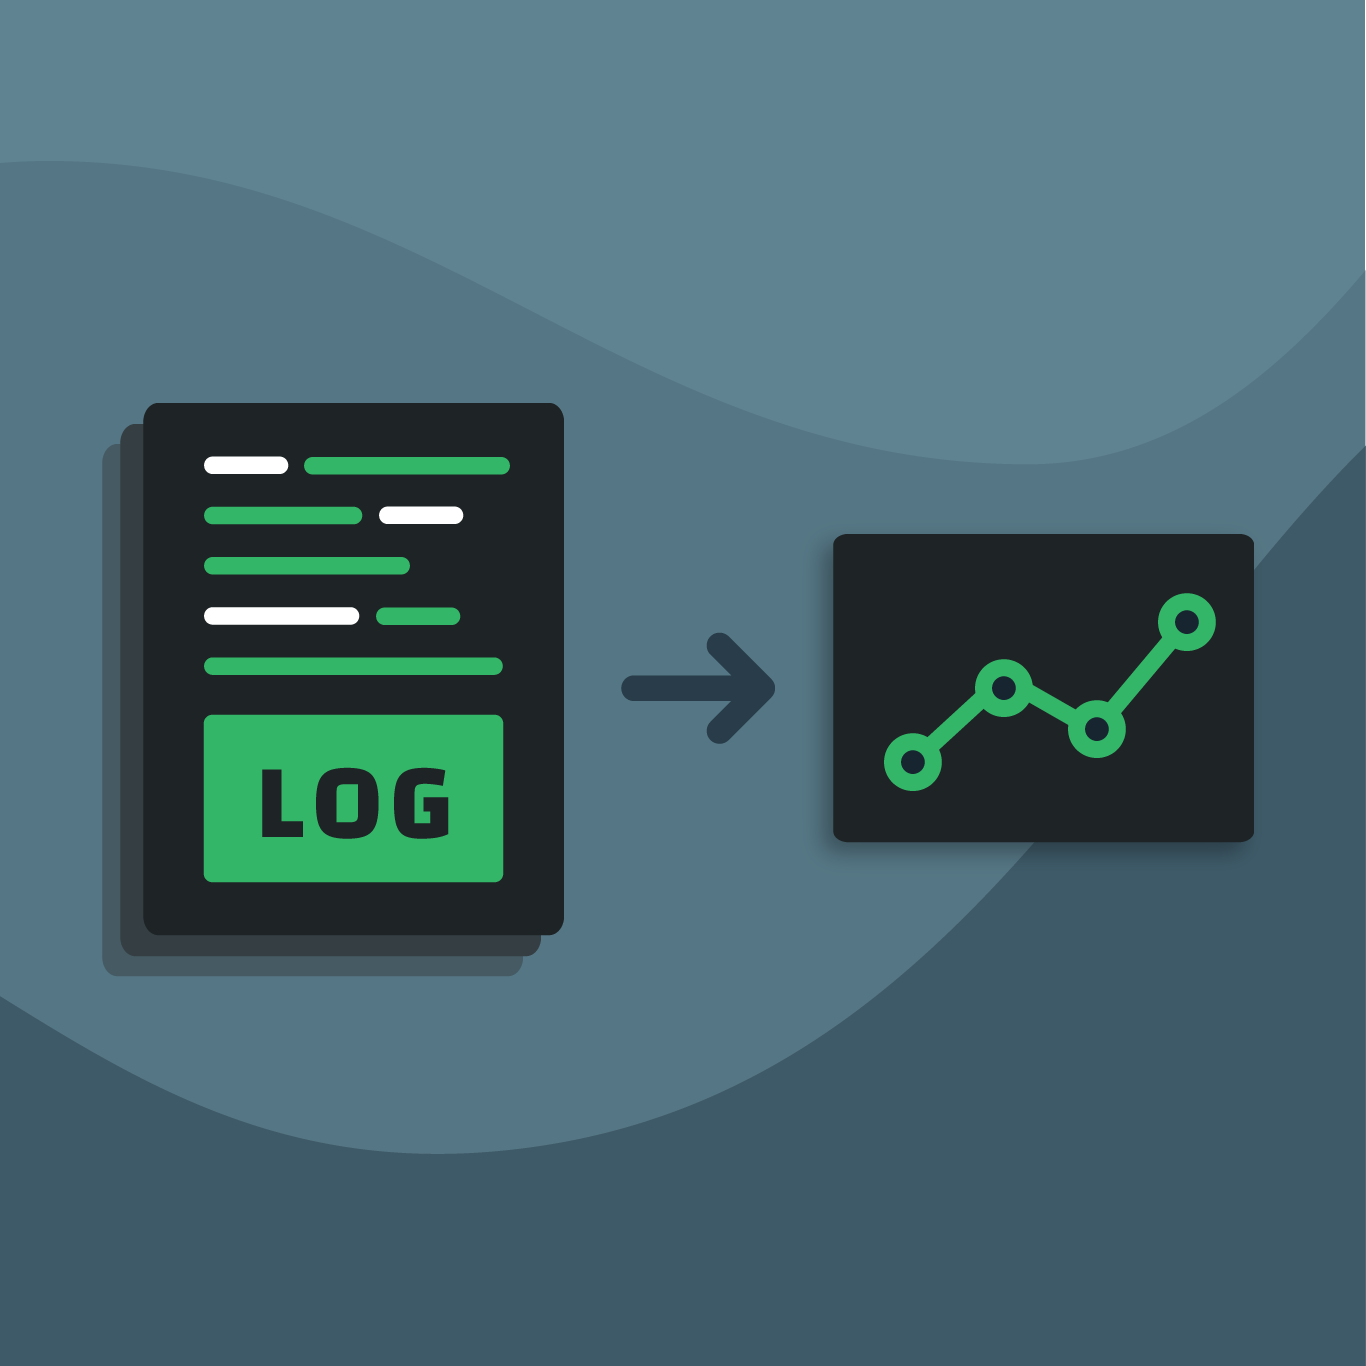
That’s why at Circonus, our platform is designed to convert logs to metrics.
The Circonus platform converts logs to metrics in real-time and stores that data in its purpose-built time series database, which can cost-effectively store highly granular metric data at unlimited scale and retention.
This makes it possible for IT teams to conduct far more sophisticated and accurate data analysis, empowering them to quickly and easily identify trends, performance issues, outliers, and anomalies.
And, by converting logs to metrics, it removes PII.
Importantly, it accomplishes all of this at the edge, only returning logs of importance for log analysis and correlation. (Learn more about Circonus log monitoring and analysis.)
The result?
- Thousands of dollars saved in storage costs per month
- Faster MTTR, leading to reduced outage time and its associated impact to bottom lines
- Significant reduction in log noise by eliminating the need to sift through mounds of useless log data
- The ability to keep all historical data infinitely at a low cost, enabling historical analysis that yields deep insights for post-mortems, faster troubleshooting, and proactive performance monitoring
In a year that has seen companies including Amazon, Youtube, Meta, Apple, Rackspace, and half of all large enterprises hit by financial losses due to outages, one thing has become clear:
It’s not a matter of if an outage will occur, but when.
The question now is, will your team be prepared with the actionable and cost-effective data they need to quickly diagnose and resolve your next outage—or better yet, prevent it in the first place?


