Dashboards and Visualizations

Quickly visualize, query, and correlate data from across your stack in real-time dashboards.

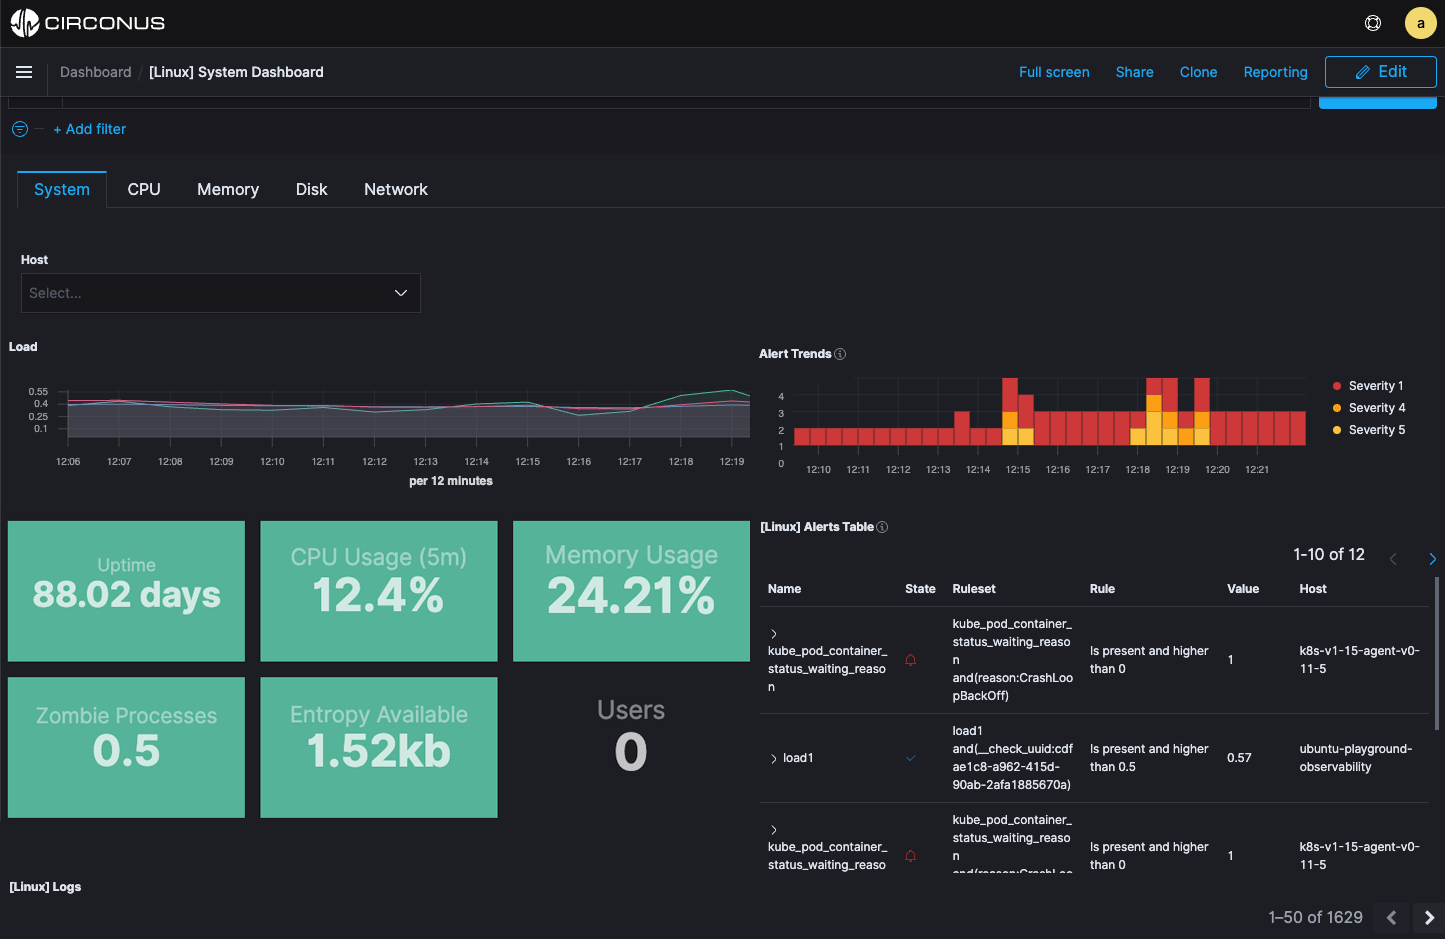
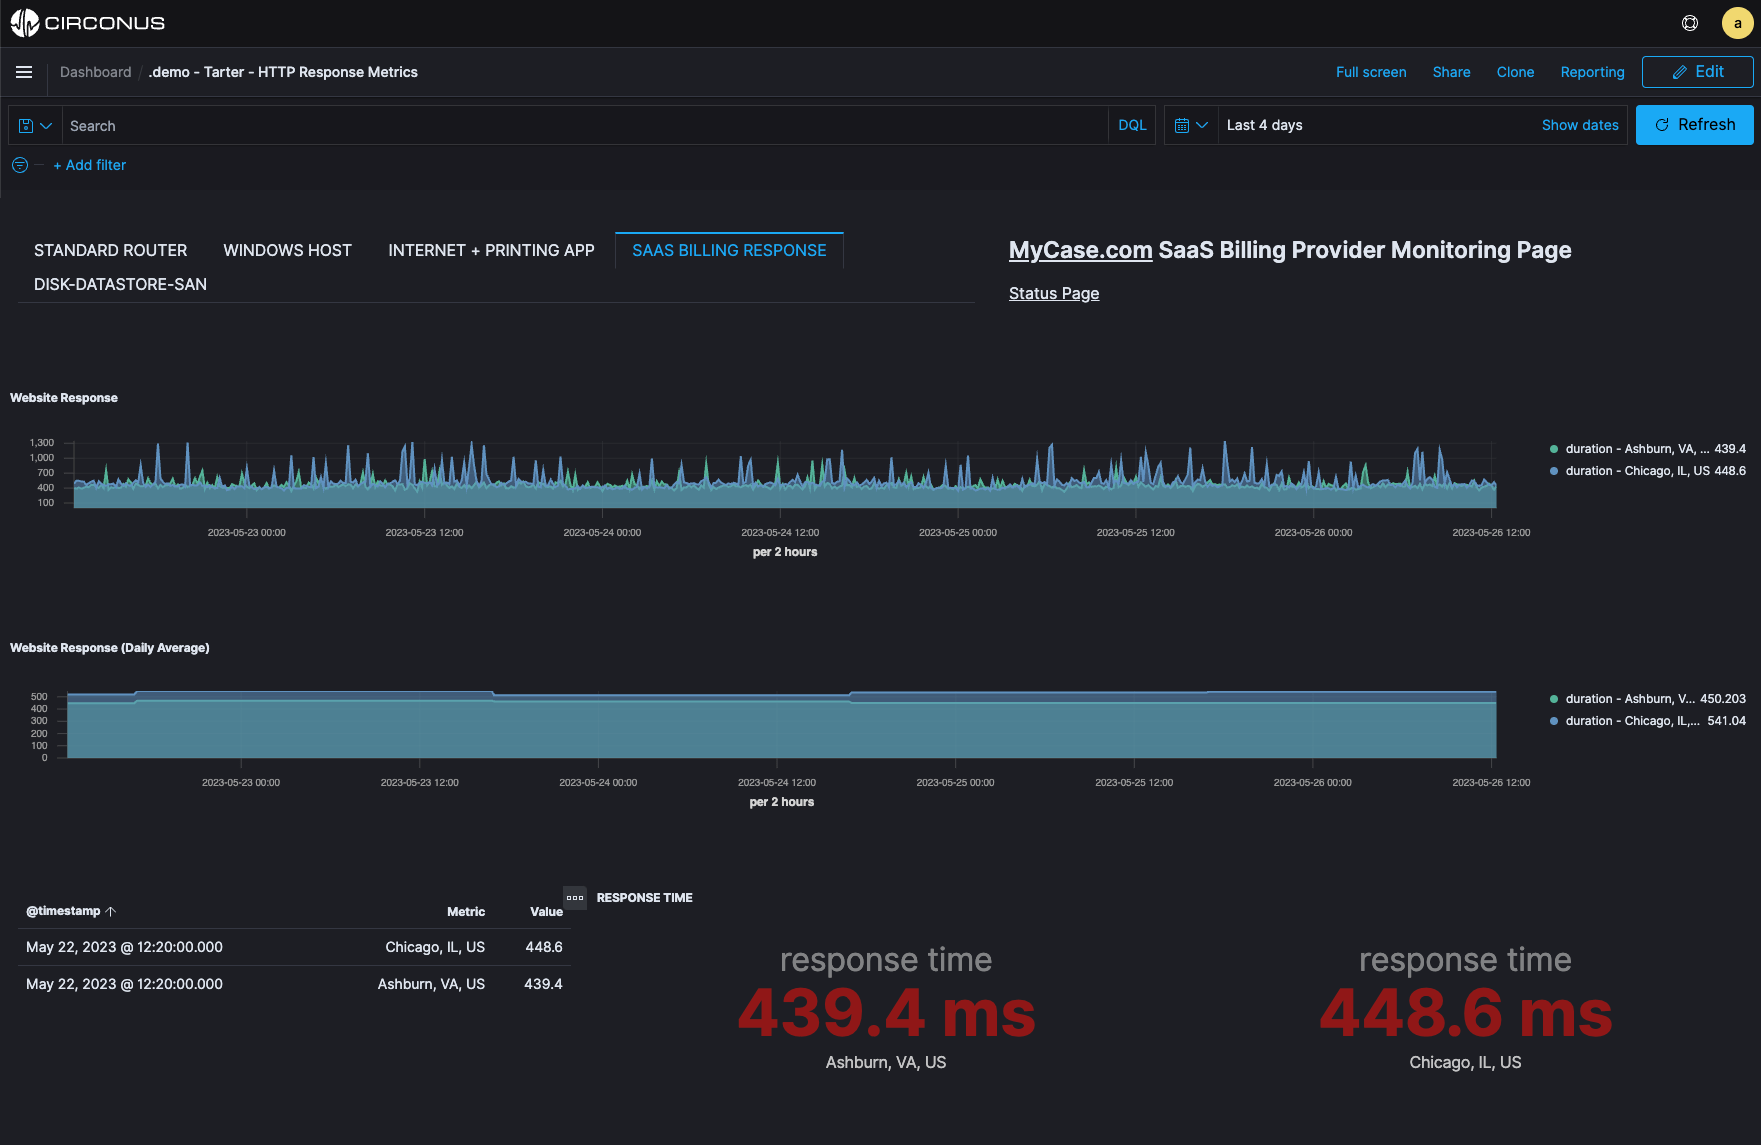
Circonus dashboards provide a unified framework for exploring your metrics, logs, and traces across your infrastructure, network, cloud, and applications. Leverage out-of-the-box dashboards or customize with a rich set of visualization tools to view trends, outliers, and patterns and readily gain the specific insights your team requires.

View & correlate your full-stack

  • Quickly explore observability data through a unified dashboard that provides a single pane of glass for you and your team.

  • Immediately correlate log errors with related throughput metrics and application latency in one view using time-based and search-based correlation.

  • Unlock analysis of real-time data.

Quickly find answers to your questions

  • Build your own dashboard with custom visualizations, charts and queries.

  • Quickly slice and dice data into one view.

  • Filter data by query, search criteria, or tags supported by the metric, log, or trace data displayed within the dashboard.

  • View different charts to identify trends, outliers, patterns, and changes over time.

Circonus Linux Dashboard Screenshot
Circonus HTTP Response Metrics Dashboard Screenshot

Collaborate across teams

  • Clone and share dashboards with relevant team members.

  • Invite others to view dashboards, and easily export dashboards as a PDF.

  • Leverage tagging and correlation to improve collaboration across different teams impacted by the same issue.

Learn the 10 Essential Monitoring Tenets to Live By

10 Principles Feature 2

10 Principles of Effective Monitoring: A Quick Checklist of Fundamentals

Reduce learning curve with support for open standards

  • Circonus dashboards are built on OpenSearch, with extended capabilities.

  • Leverage out-of-the-box support for open query languages such as Lucene, DQL, PPL and PromQL.

  • Add data from open source collection agents like Prometheus, Telegraf, StatsD, Fluent Bit, Fluentd, Data Prepper, Logstash, and OpenTelemetry.
OTEL Dashboard
Time Series Builder Screenshot

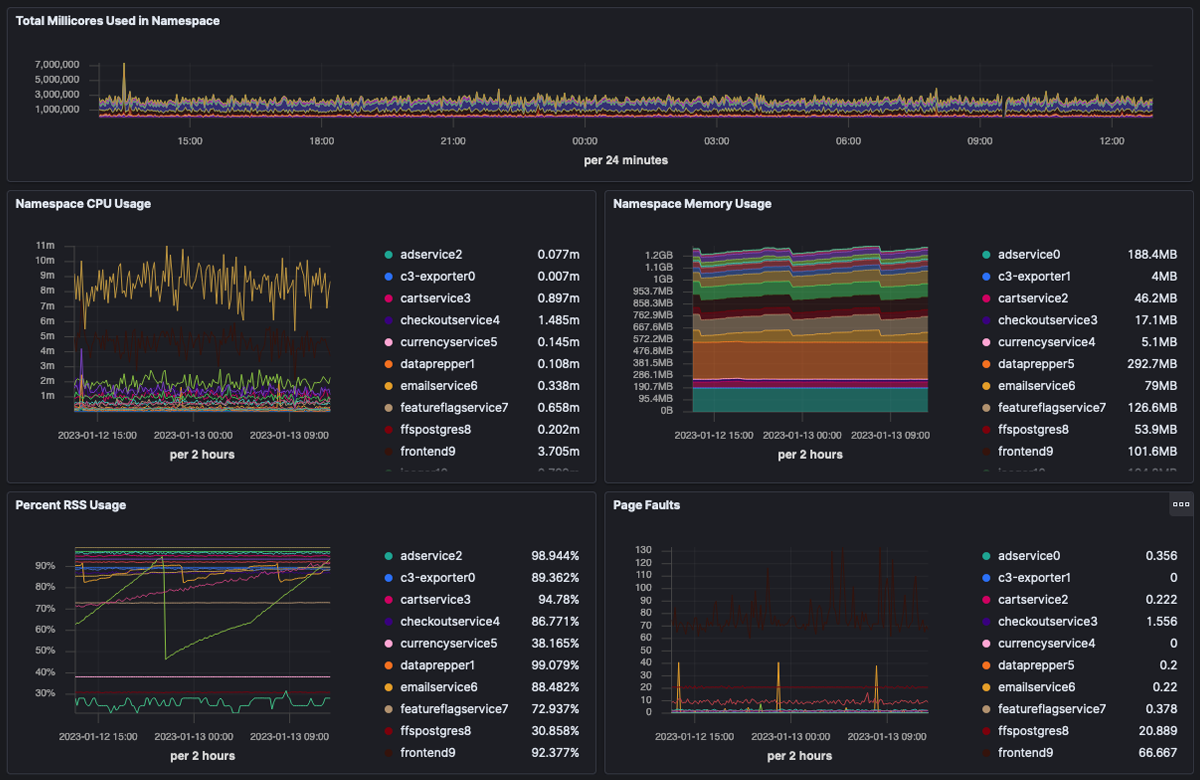
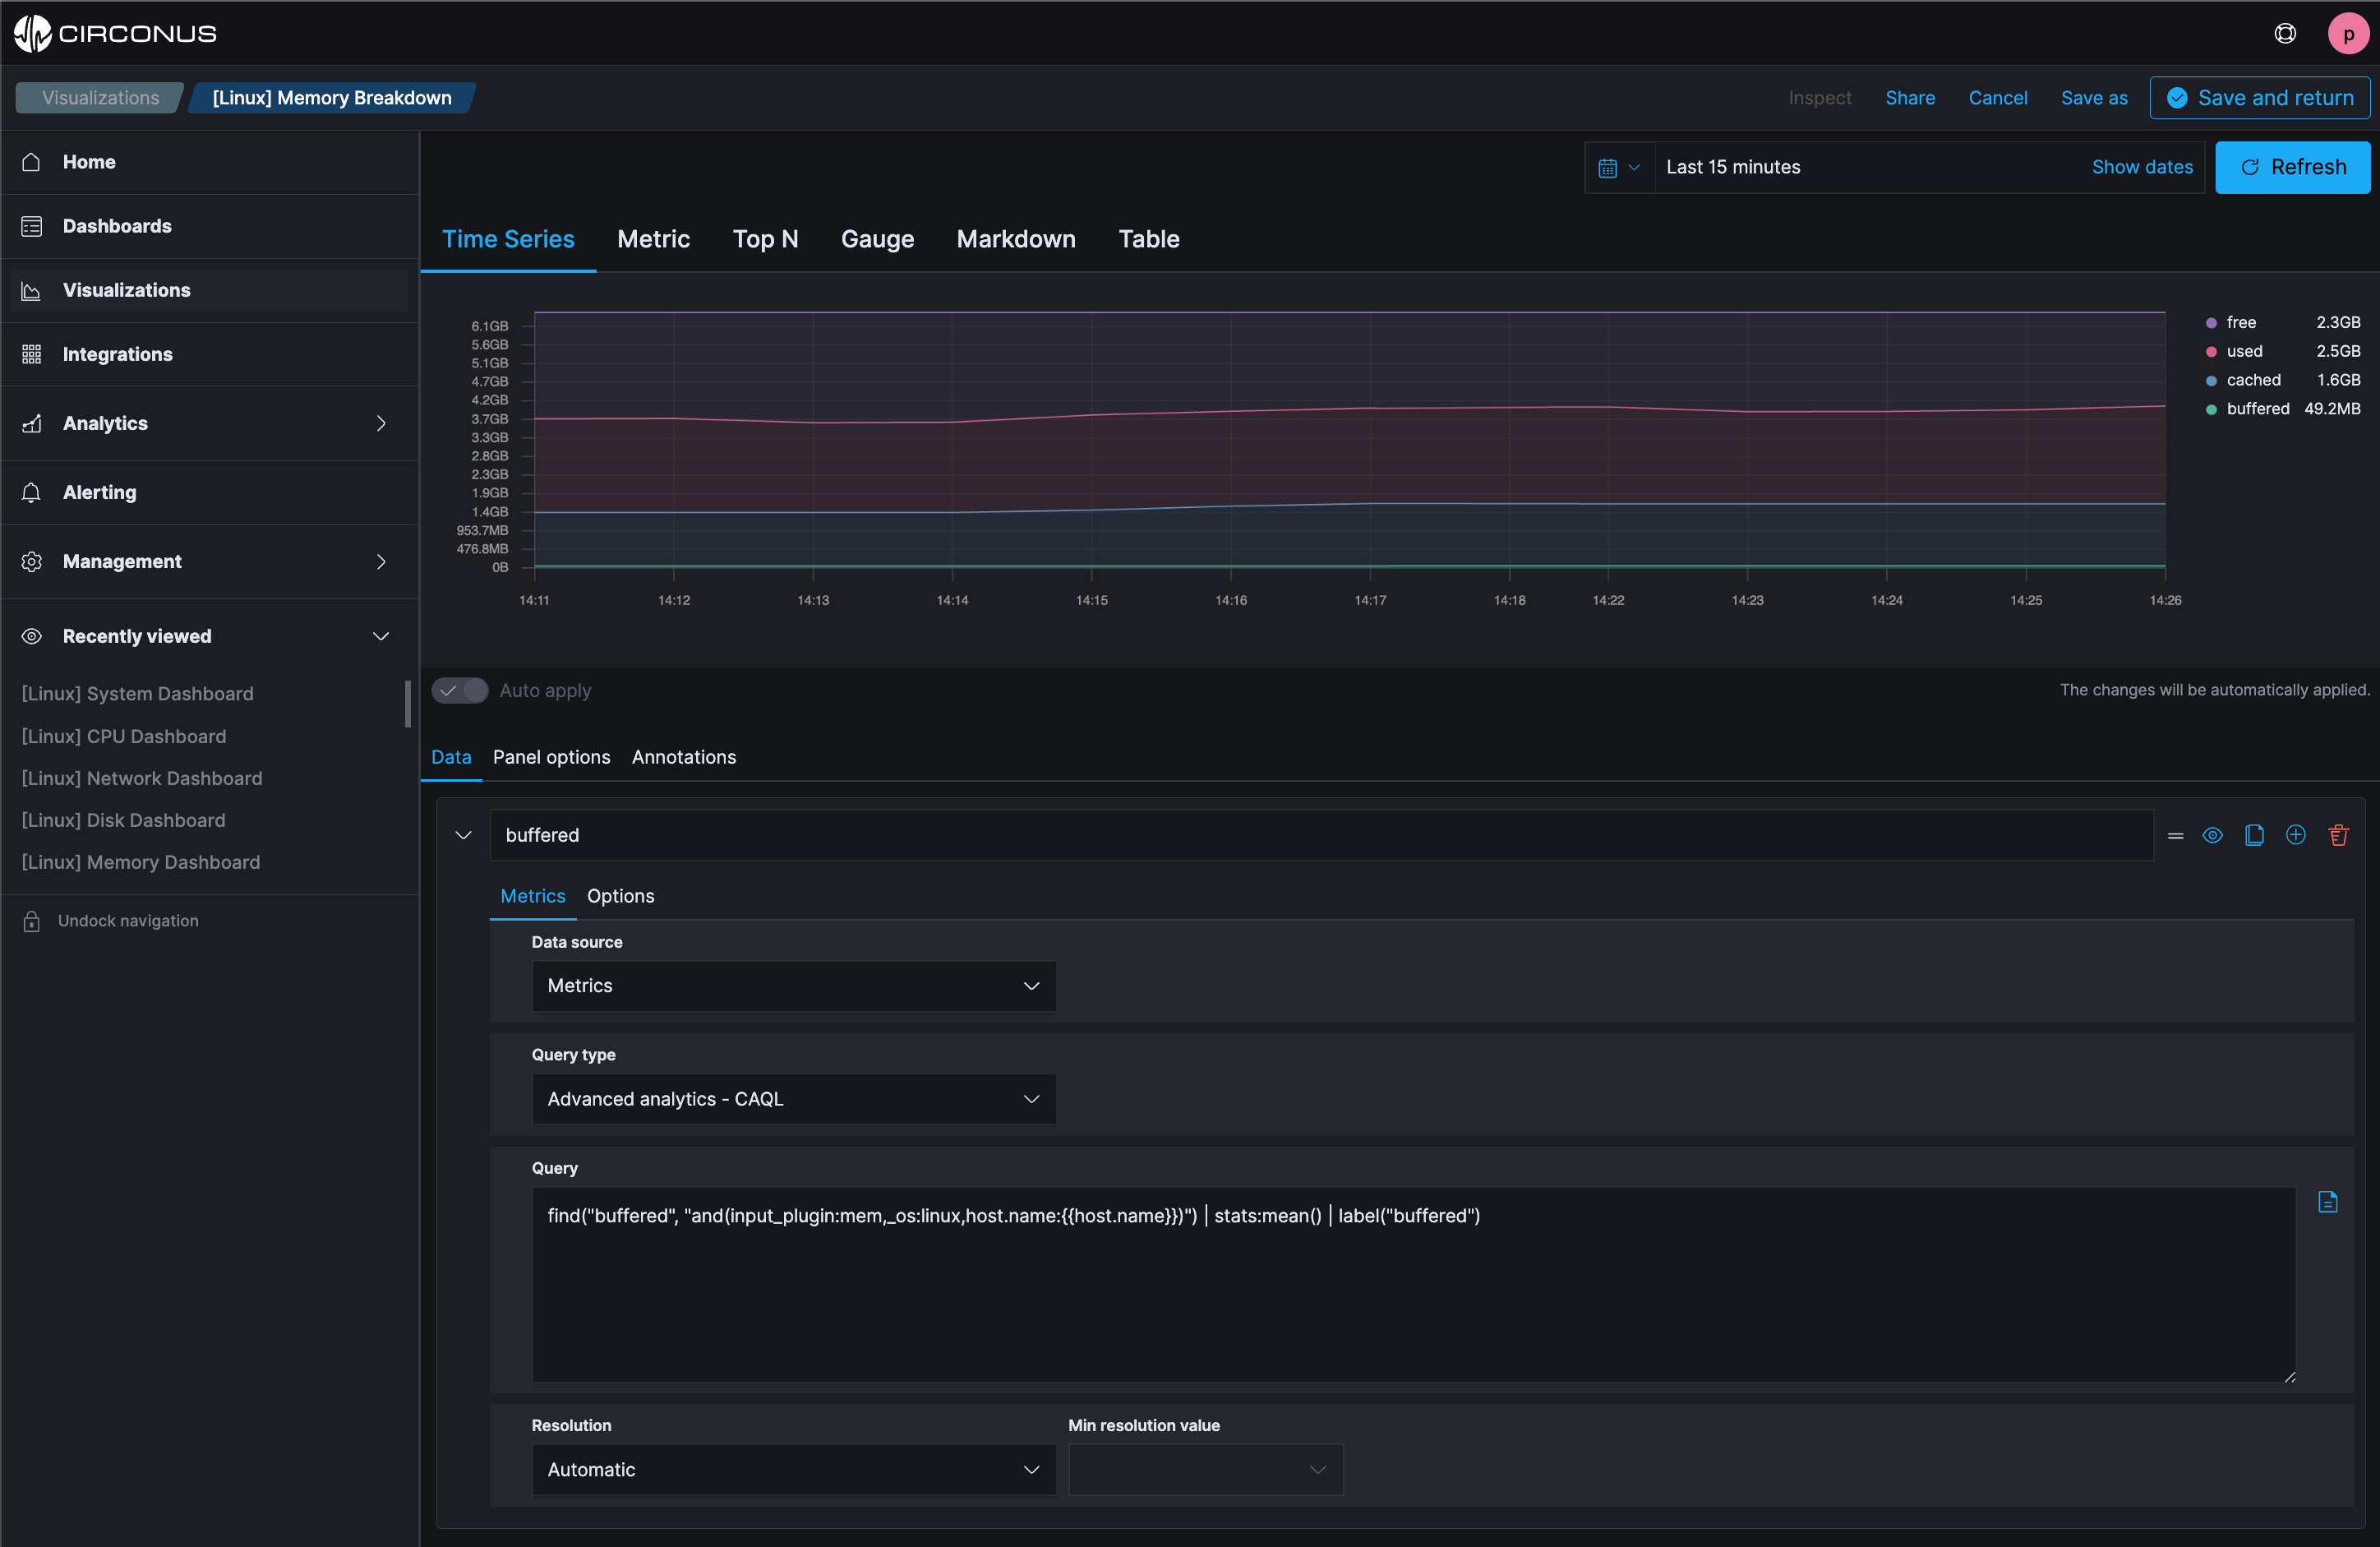
Leverage rich set of visualizations

  • Build dashboards from a rich collection of visualization panels.

  • Leverage visualizations to ask questions like who is being impacted by issues, when will my apps exhaust capacity, why am I seeing performance spikes, how can I determine root cause, and more.

With Circonus we have been able to merge application performance modeling with SLOs, Kubernetes monitoring, and traditional network and hardware monitoring at high (and growing!) scale.

The richness of this high frequency data allows us to understand user and systems behavior with a level of detail we haven’t experienced as an organization before now. The ability to perform real-time analysis on billions of data points drives how we think about, and debug, performance for millions of baseball fans. Combined with a monitoring-as-code approach, our engineers get all of this delicious data out of the box with little to no time spent.

Riley Berton, Principal SRE
Major League Baseball

See where Circonus can take you.

Learn how monitoring without limits can drive new levels of value and impact in your business and operations.