
We’re excited to announce that we just released the next-generation of our observability platform – the Circonus Telemetry Cloud™. Here’s a closer look at what it is and why we think it’s a standout in […]
As organizations shift to service-centric environments, they are generating substantially more data. This in turn has placed strains on monitoring and observability teams, who now must sift through an abundance of data in order to identify and resolve issues — a challenge exacerbated by the number of various monitoring tools they’ve implemented over the years.
Circonus has released several new features and enhancements that revolutionize visibility into your infrastructure’s performance. Let’s explore each of these exciting updates. Circonus Unified Agent We would like to formally announce Circonus Unified Agent, which […]

We’re excited to announce today Circonus’ Spring ’22 Release, which adds capabilities to further support the observability demands of modern-day enterprises. The Spring Release adds features across all four components of the Circonus platform – […]
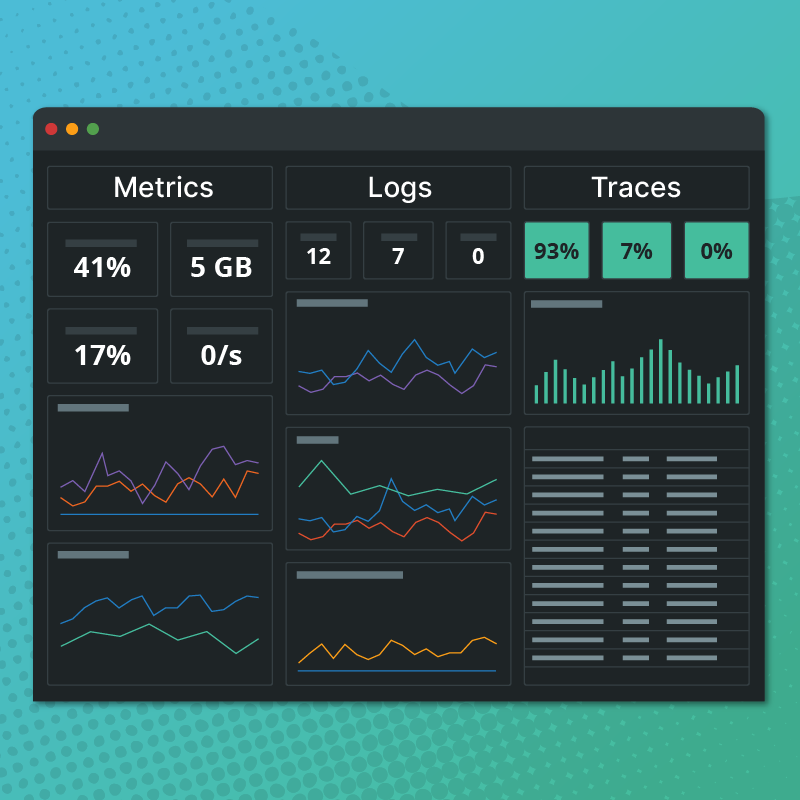
We recently announced the development of our new dashboard builder and associated release of several new turnkey service dashboards. The new dashboard builder provides a vastly improved user experience, enabling users to create dashboards in […]
Over the past few months, we’ve been working on some major updates to Circonus — a new dashboard builder and interface along with several turnkey service dashboards. In the following post, we’ll share the motivation […]

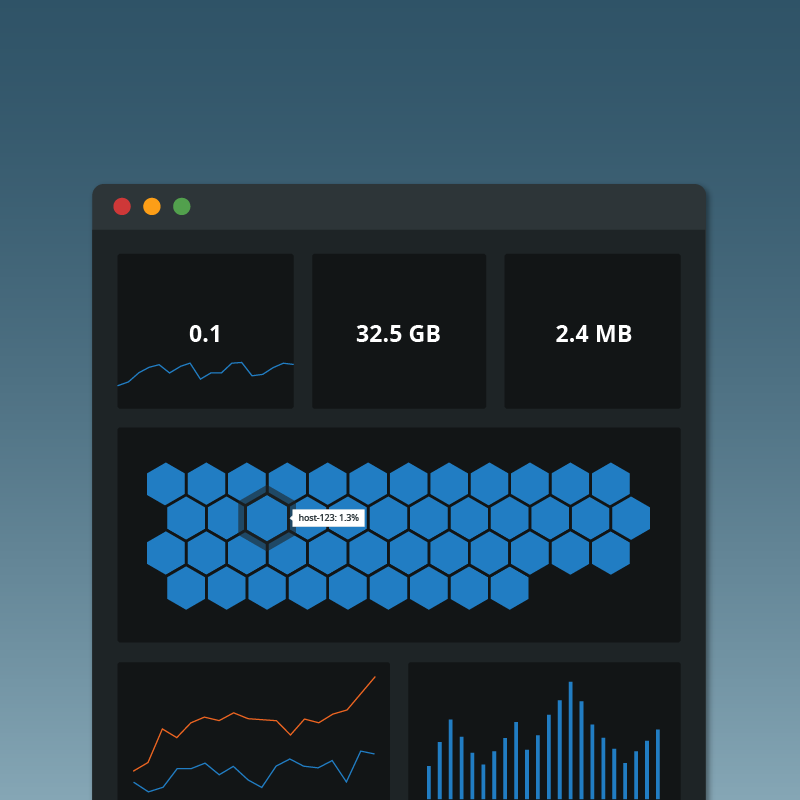
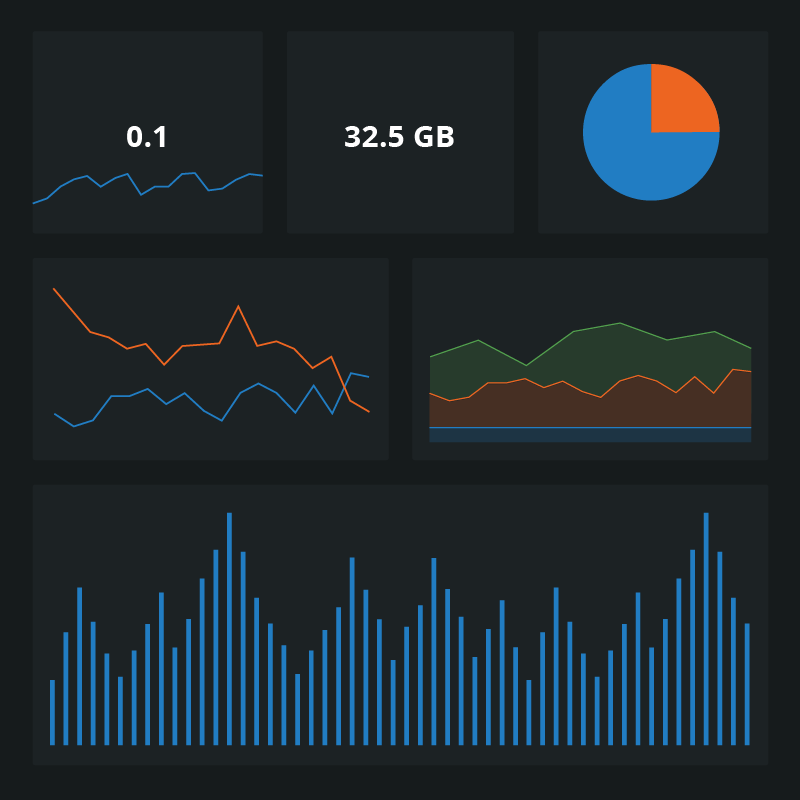
Circonus’ new Linux host monitoring dashboard is the most comprehensive host monitoring available in the market – yet also extremely easy to install and use, allowing users to more efficiently and accurately monitor their Linux […]

We originally built the Metrics Explorer to help customers find and view their metrics within the platform. Once surfaced, metrics can be used to create graphs and set up associated rules and alerts. Despite well-intentioned […]
Circonus is a full-stack monitoring solution for the modern-day enterprise that delivers crystal-clear, real-time observability of the behavior, health, trends, and performance of the entire enterprise footprint from edge to edge in one unified platform.
40 Lloyd Avenue, Suite 306
Malvern, PA 19355
888-840-8133